
Fundamental analysis of JPMorgan stock 2026

JPMorgan Chase: Anatomy of a Banking Empire, and What the Stock Is Actually Worth Today
A few months ago, while lining up the financial statements of several major U.S. banks side by side, something caught my attention: JPMorgan stays profitable in almost every economic scenario you can imagine — recession, inflation, high rates, banking-sector panic. That’s not an accident. So this time, instead of a surface-level overview, I went straight into the 200-page Q2 2026 10-Q filing, the official earnings presentation, and Jamie Dimon’s annual shareholder letter, and recalculated every ratio myself from scratch. What follows is what came out of that — with precise numbers, not guesses.
Part One: What JPMorgan Actually Is, and How It Makes Money
JPMorgan Chase traces back to 1799, and today it’s the largest U.S. bank by assets — roughly $5 trillion sitting on its balance sheet. But what really separates it from peers is revenue diversification. While most banks lean almost entirely on traditional lending, JPMorgan runs on four largely independent revenue engines, each of which tends to perform well in a different part of the economic cycle:
Consumer & Community Banking (CCB) is the part most Americans know as Chase — checking accounts, credit cards, mortgages, auto loans. This segment generated $20.3 billion in revenue in Q2 2026, roughly 35% of total company revenue, with a return on equity of 34%.
Commercial & Investment Bank (CIB) is the largest segment — about 43% of total revenue — covering market-making, underwriting, M&A advisory, and global payments. Interestingly, despite having the biggest revenue share, its ROE (22%) is lower than CCB’s, simply because market-making and lending activities consume far more regulatory capital.
And here’s where a pattern gets interesting: Asset & Wealth Management (AWM), with the smallest revenue share (just 12%), posts the highest return — a 48% ROE. Why? Because this is a fee-driven business, not a balance-sheet-driven one; it holds relatively little capital and earns mostly from managing client assets. This is the classic capital-efficiency pattern in banking: capital-light businesses almost always generate higher returns than balance-sheet-heavy ones.
One management note worth flagging: on June 25, 2026, Doug Petno and Troy Rohrbaugh — previously co-CEOs of CIB — were elevated to Co-Presidents of the firm; Petno stayed on as CIB CEO while Rohrbaugh became the new CCB CEO, and Marianne Lake retired after more than 25 years with the firm. This isn’t just routine corporate news — it’s part of the succession framework for a post-Dimon era, something the market has long flagged as a key risk factor.
Part Two: The Numbers Behind the Story — From Revenue to Earnings Quality
If I had to sum up a bank’s financial health in three numbers, they’d be: how much revenue it generates, how much of that becomes net income, and how efficiently it’s deploying shareholder capital.
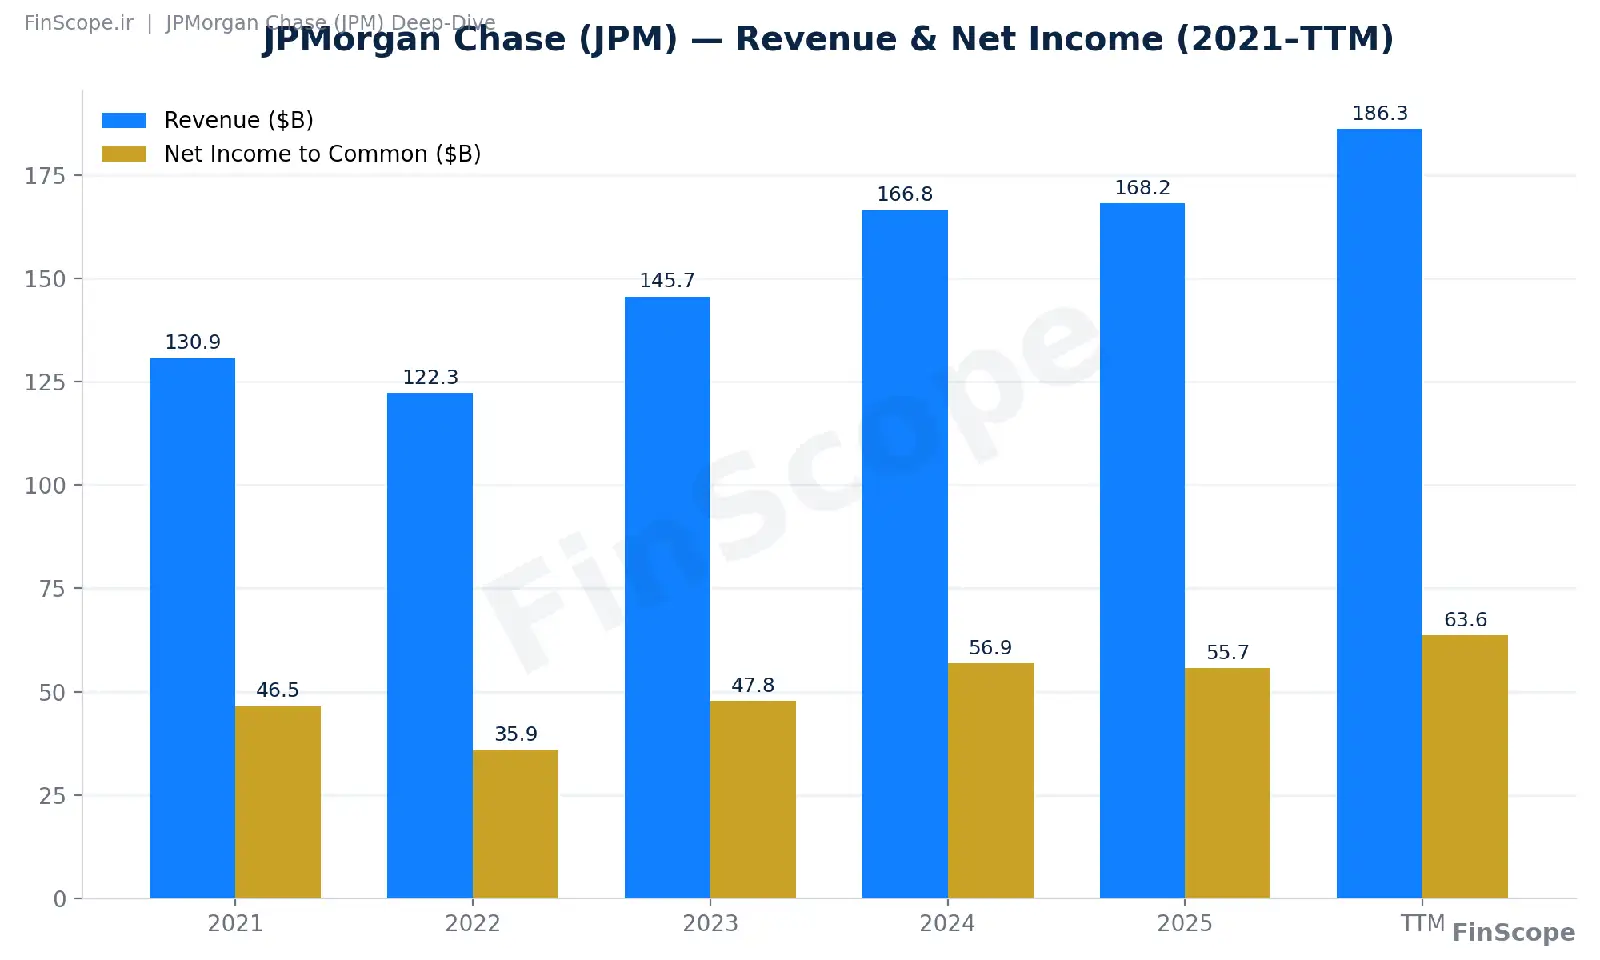
The thing that jumps out at me every time I look at this chart is the sharp net income drop in 2022 (from $46.5B to $35.9B) despite revenue falling only 6.6%. My first instinct was to assume some operational problem, but tracing it back revealed a different story entirely: during Covid, the bank had set aside a large credit loss reserve; part of that reserve was released in 2021, artificially inflating that year’s earnings (a record $48.3B), and the following year, on renewed recession fears, the bank rebuilt reserves again — making 2022 look like a sharp decline relative to an artificially high baseline. This is exactly the kind of thing you need to watch for when analyzing banks — reported earnings are rarely the full story, and the question to always ask is: where did this profit actually come from?
From there, the trend is almost uninterrupted upward: revenue climbed from $145.7B in 2023 to $186.3B on a trailing-twelve-month basis. Q2 2026 alone was one of the strongest quarters in the bank’s history: total revenue of $57.3B (+28% YoY) and net income of $21.2B (+41% YoY). But before getting too excited, it’s worth being precise about where that jump came from: part of it was a one-time item — a $4.6B gain from the Visa share exchange, plus roughly $1B from remeasuring certain equity investments. Strip those out, and core net income comes to $16.9B, with ROTCE adjusting from 29% down to 23% — still a very strong number, but a more honest picture.
One thing that stood out when comparing revenue growth (27.7%) against expense growth (14.9%) is the gap between the two — what’s called positive operating leverage — which comes to nearly 13 percentage points. This is one of the strongest health signals a bank can show, because it means growth is coming from genuine efficiency gains, not from inflating headcount or tech spend to chase the same growth rate.
And before moving past this section, I also looked at the cash flow statement, because it contains something that can be genuinely confusing: the company’s six-month operating cash flow is negative $237 billion. For a normal company, that would be a red flag. For a bank, it means something entirely different — this figure mostly reflects growth in trading assets and new loan originations, i.e., the business itself getting bigger, not a liquidity shortfall. The real measure of a bank’s liquidity health is its Liquidity Coverage Ratio (LCR), which for JPMorgan stands at 110% (firm-wide) and 118% (at the bank subsidiary level) — both comfortably above the 100% regulatory minimum.
Part Three: Under the Hood of the Balance Sheet and Credit Quality
JPMorgan’s balance sheet grew at a pace unusual for a bank this size over the past year: total assets rose from $4.55T to $5.02T (+10.2%), and loans grew from $1.41T to $1.54T.
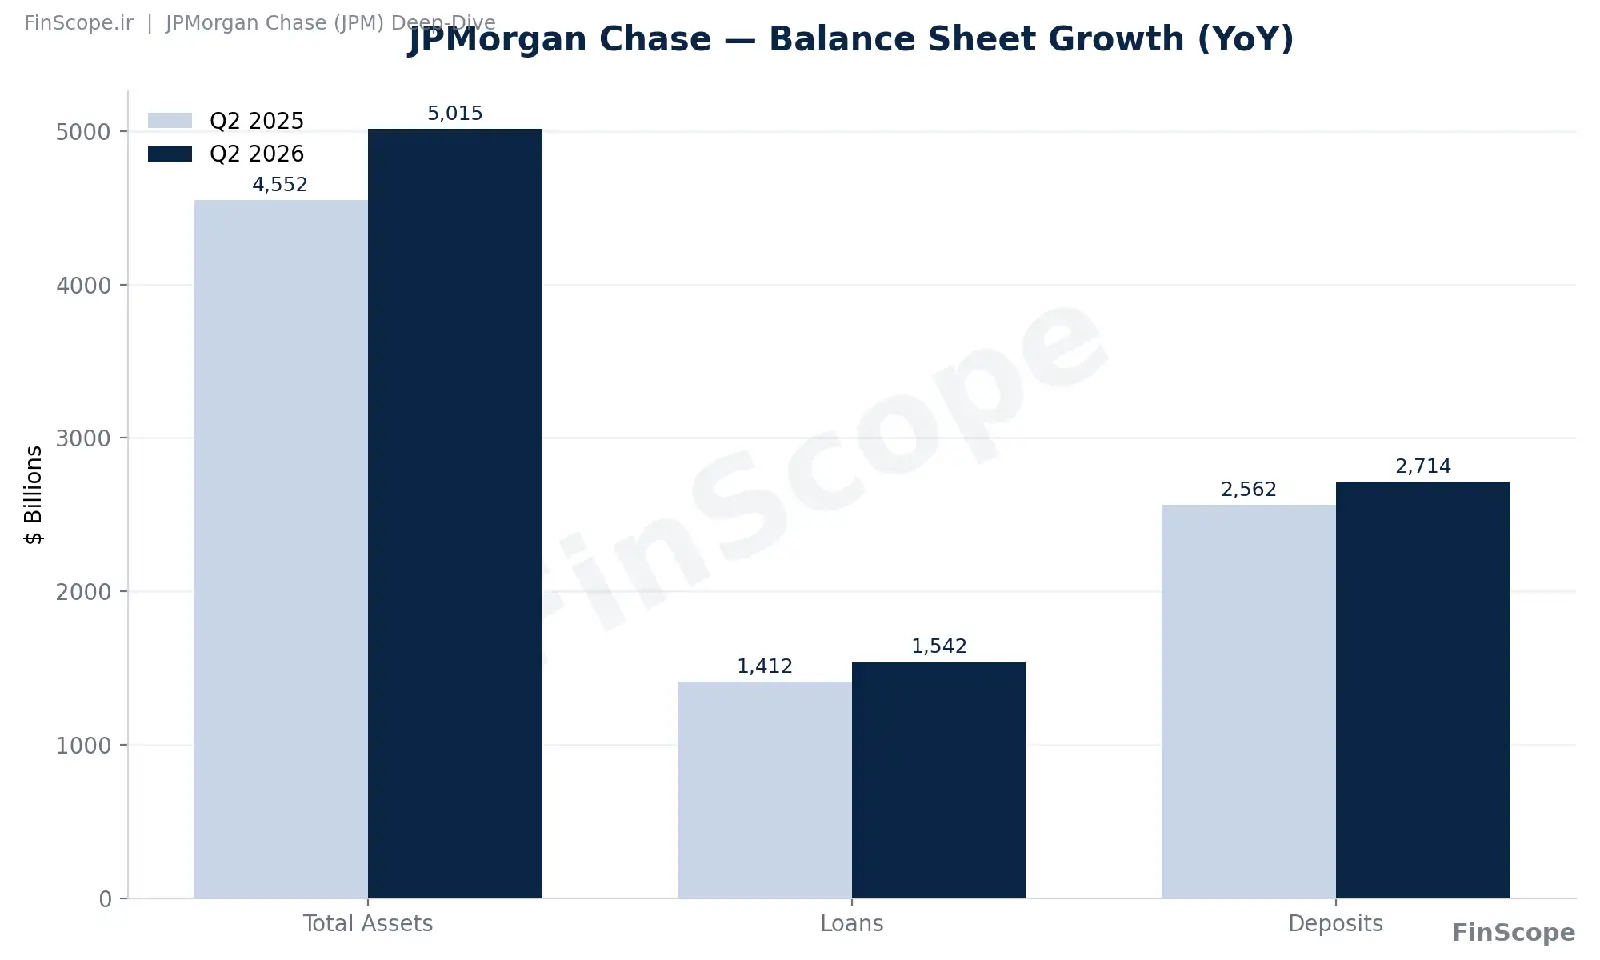
What matters for assessing the health of this growth is that the loans-to-deposits ratio has held steady at 57% — meaning that despite rapid growth, the bank remains conservative, keeping a significant portion of deposits in liquid, safe assets rather than aggressively lending them out. The net charge-off rate has also improved to 0.66% (from 0.73% a year earlier), and the allowance-to-nonperforming-assets coverage ratio sits around 320% — meaning for every dollar of loans at risk of default, the bank has set aside more than three dollars in reserves.
One small but notable thing I found in the data: the share of deposits in total liabilities dropped from 63% at the end of 2025 to 58% at the end of Q2 2026, meaning the bank has become slightly more reliant on wholesale funding (repo, long-term debt). This isn’t a red flag yet, but it’s worth tracking.
On the regulatory capital side, the CET1 ratio sits at 14.2% — 270 basis points above the 11.5% required minimum. In the Federal Reserve’s annual stress test in June 2026, JPMorgan, along with 31 other major banks, comfortably cleared the hypothetical severe-recession scenario; the direct result was a board decision to raise the quarterly dividend from $1.50 to $1.65 per share and approve a fresh $50 billion buyback program.
Part Four: How It Stacks Up Against Peers — Is the Premium Justified?
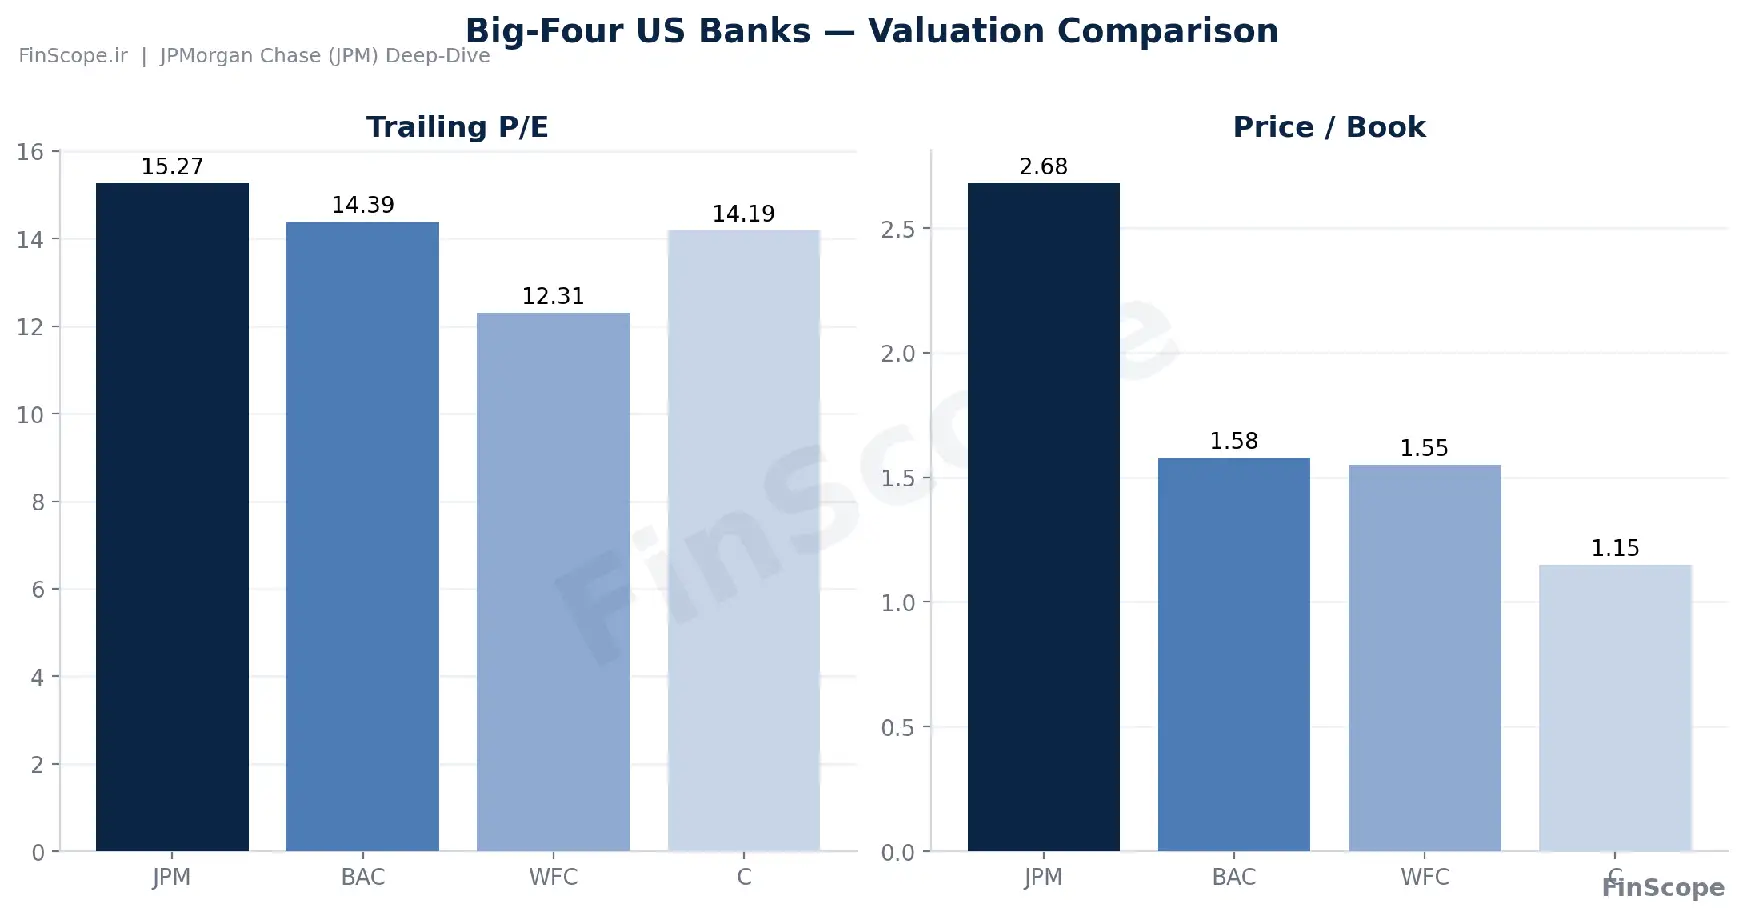
This is where things get genuinely interesting. If you only look at the net income figure, JPMorgan wins outright. But the real question for an investor is: is the price being paid for that quality reasonable?
| Metric | JPM | Bank of America | Wells Fargo | Citigroup |
|---|---|---|---|---|
| Trailing P/E | 15.3x | 14.4x | 12.3x | 14.2x |
| P/B | 2.68x | 1.58x | 1.55x | 1.15x |
| PEG (5-year) | 1.74x | 1.06x | 1.60x | 0.71x |
The number that speaks loudest here is price-to-book. JPMorgan trades at 2.68x book value, while Citigroup trades at just 1.15x — meaning the market is willing to pay more than double, per dollar of capital, for JPMorgan than it is for Citigroup. That premium isn’t random; it’s a direct function of higher returns on capital and the stability Jamie Dimon himself calls the “fortress balance sheet.” But JPMorgan’s higher PEG (1.74 versus Citigroup’s 0.71) carries an important message too: this is no longer a “cheap stock” story — it’s a quality story, priced accordingly.
One more angle worth noting: if JPMorgan traded exactly at the average multiple of its peers — rather than at its current premium — its price would land somewhere between $190 and $318, not $355. That gap is essentially the premium the market is willing to pay for this bank’s quality.
Part Five: A Few Calculations That Round Out the Picture
To avoid just taking things at face value, I ran a few standard financial models on the company’s own numbers.
First, a DuPont breakdown — decomposing return on equity into three components: profit margin, asset turnover, and financial leverage. Running this for Q2 2026, I got a net margin of 36.9%, an annualized asset turnover of about 4.6%, and a leverage multiplier of 14.5x — which, multiplied together, reproduce the reported ROE of roughly 24.5%. That tells us the recent ROE improvement comes both from a genuine improvement in operating margin and from the natural rise in financial leverage inherent to the banking model — not merely a one-off effect.
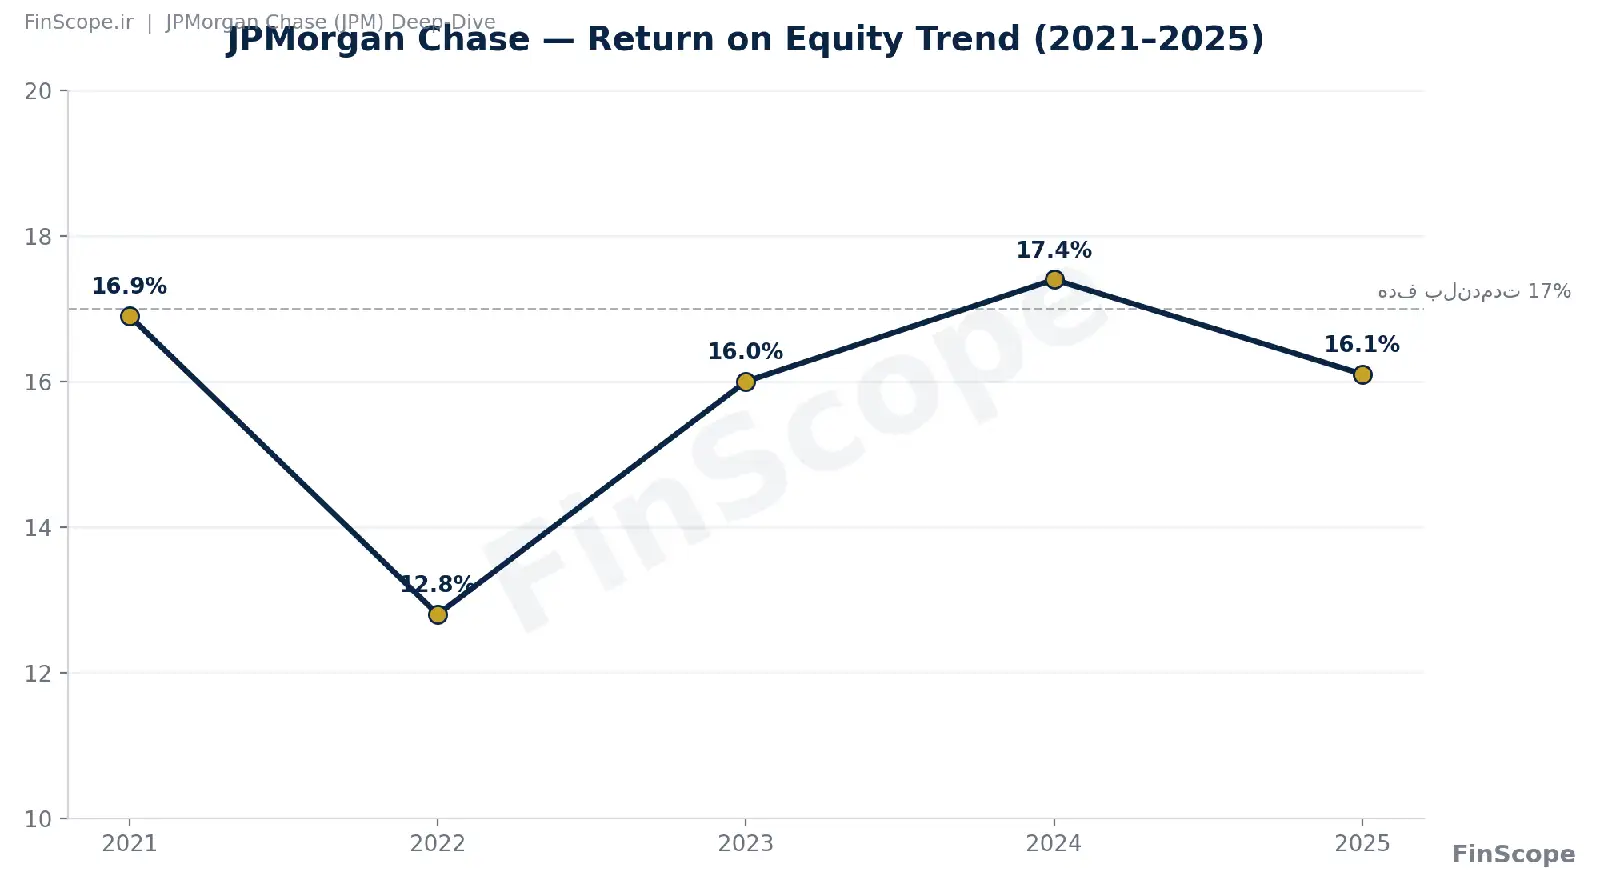
Second, for valuation, rather than relying solely on relative multiples, I used a standard bank-valuation formula that ties price-to-book directly to ROE, cost of equity, and sustainable growth: Justified P/B = (ROE − g) / (Ke − g). Assuming a long-run ROE of 17% (management’s own stated target), a cost of equity between 9.5% and 10.5%, and sustainable growth of 4–5%, this produces a target price range of $266 to $355, with the base-case scenario landing squarely between $266 and $302.
Interestingly, when I ran the same exercise through a dividend discount model (DDM), I got a noticeably lower number — somewhere between $101 and $220. My first thought was that I’d made an error, but the reason is perfectly logical: JPMorgan only pays out about 30% of earnings and retains the other 70% to compound book value. A simple dividend-based model ignores this hidden internal growth engine entirely, so this figure should be read only as a conservative floor, not the primary valuation anchor.
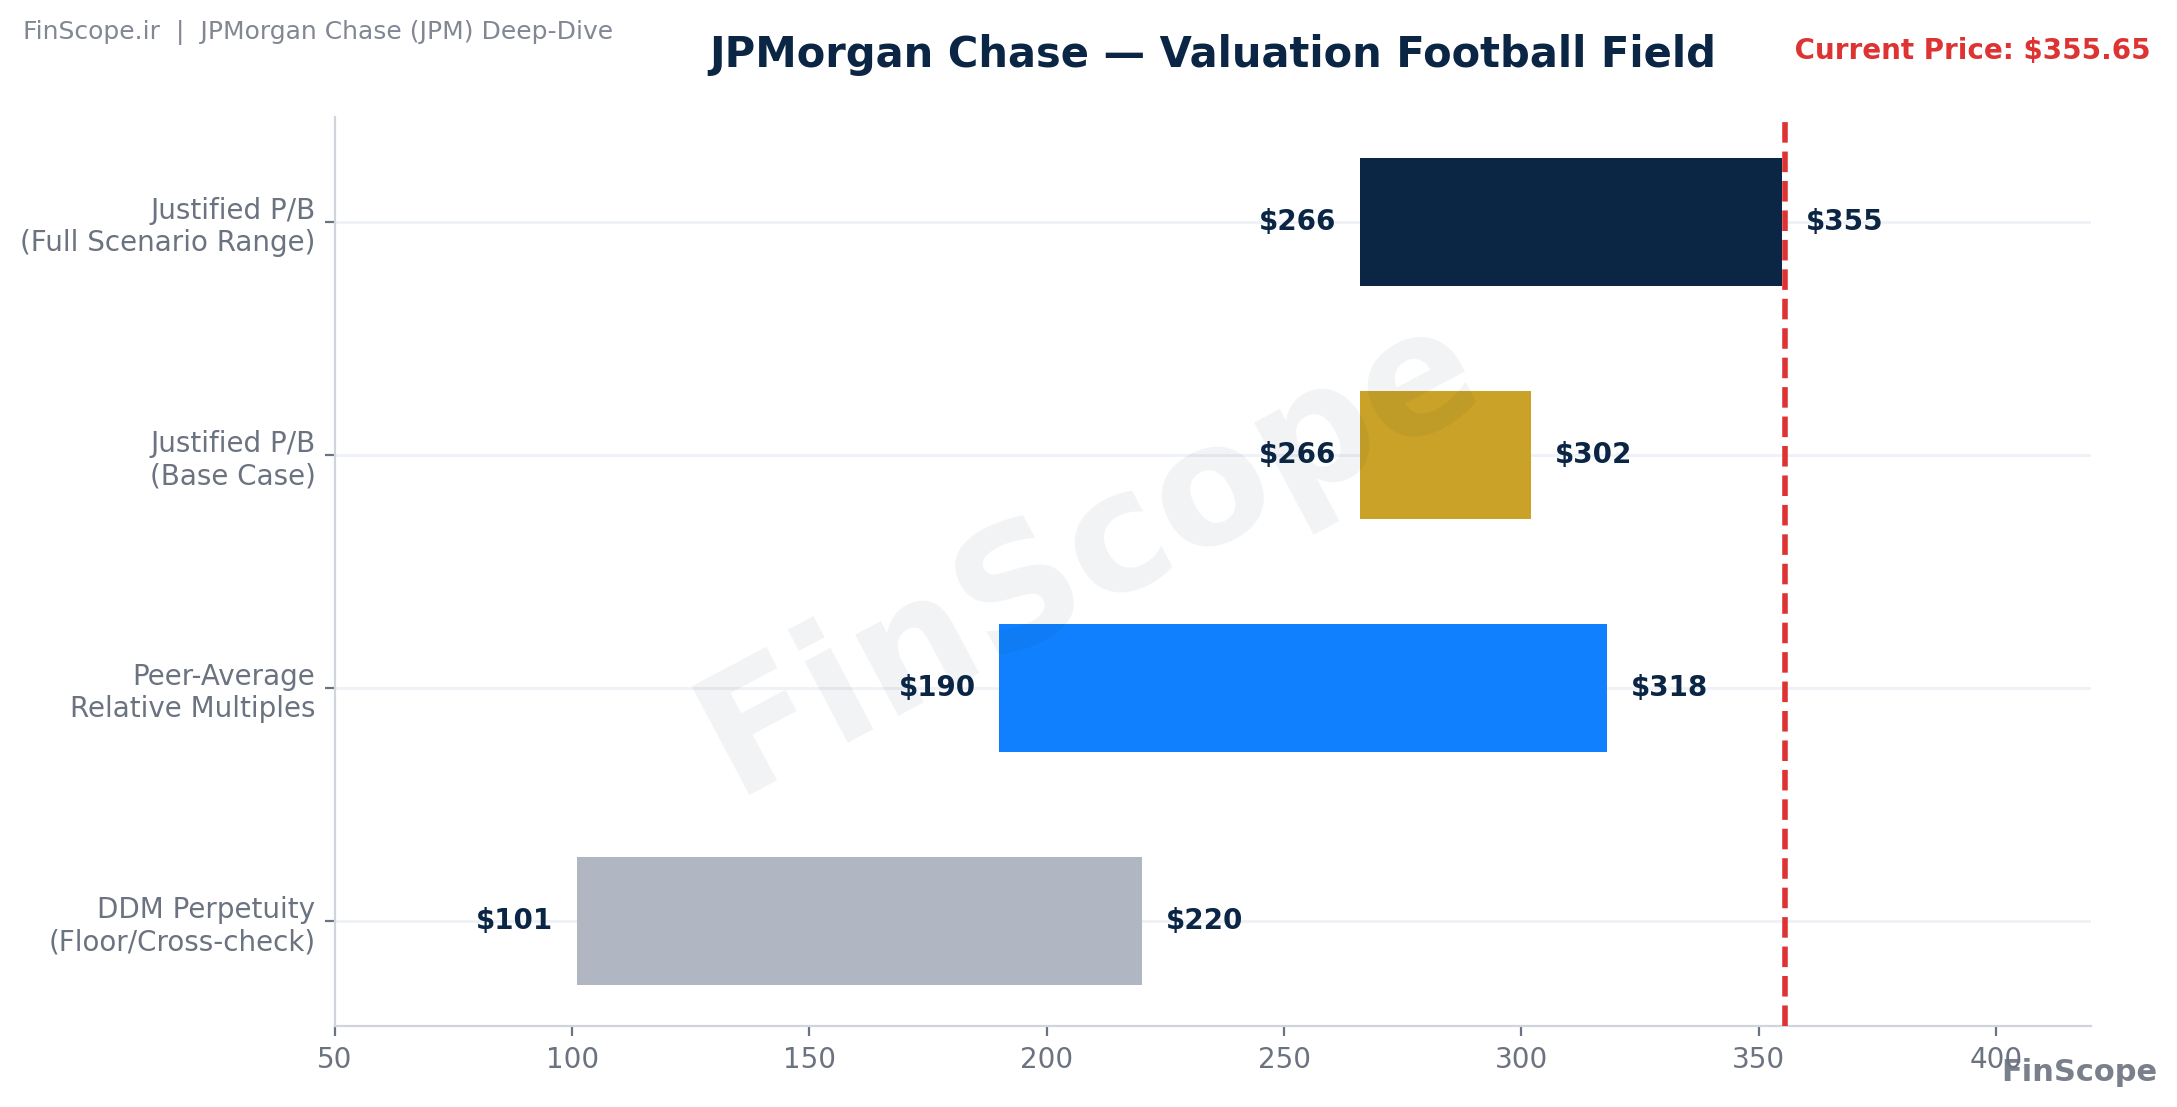
When I lay these three methods — relative multiples, justified P/B, and DDM — side by side (what analysts call a “football field”), the message converges: the current price of $355.65 sits near the top of the ranges produced under base-case and conservative scenarios, and is only fully justified under a fairly optimistic scenario assuming a sustained ROE above 20%.
Part Six: Risks Worth Taking Seriously
No analysis is complete without a proper risk section. The most significant ones, pulled directly from the company’s own filings and Dimon’s letter:
Proposed revisions to Basel III Endgame could push JPMorgan’s GSIB capital surcharge to roughly 5.2% by 2028, requiring billions in additional capital — management itself has openly criticized this formula, arguing it raises the cost of credit for American households. The firm’s interest rate sensitivity is also notable: by its own disclosure, a sudden 200 basis-point drop in rates could reduce annual net interest income by as much as $5.1 billion. Meanwhile, roughly 43% of revenue comes from CIB, which is sensitive to market volatility — in calmer market periods, this engine naturally slows down.
And finally, in his most recent shareholder letter, Jamie Dimon himself warned that global sovereign debt and deficits are at record levels, asset prices are elevated with tight credit spreads, and the combination of these factors with trade and geopolitical tensions could trigger an unexpected tipping point at any moment — a warning coming from the company’s own CEO, not an outside critic.
Part Seven: Bottom Line and a Framework for Deciding
After all this digging, the picture that emerges of JPMorgan is this: a bank with unmatched revenue diversification, an exceptionally strong balance sheet, management with a proven multi-decade track record (its stock has compounded roughly 2.6 percentage points annually ahead of the S&P 500 since 2004), and a consistent record of out-earning peers. These are all measurable facts, not marketing slogans.
But the price reflects that quality too. The three independent valuation methods I ran all converge on the same conclusion: the current price sits above the base-case fair value range of $266 to $302. That’s not a sell signal for someone who already owns the stock — the underlying quality is real and supports holding. But for someone looking to build a new position, it makes more sense to either wait for a pullback or build the position gradually over time rather than buying all at once at current levels.
If you’re drawn to relative value and re-rating potential, peers like Citigroup (with a lower PEG and an ongoing structural turnaround story) may be more compelling, though they come with more execution risk. And if you’re concerned about the repeatability of recent earnings, keep in mind that a meaningful portion of this quarter’s profit came from one-time items and capital-markets strength; the adjusted earnings figure — showing roughly 23% ROTCE — is the more conservative basis for comparison.
Ultimately, these are the findings of a data-driven analysis, not personalized investment advice. Any decision to buy or hold should be made in light of your own time horizon, risk tolerance, and portfolio composition, ideally in consultation with a licensed financial advisor.
This analysis is based on JPMorgan Chase’s official 10-Q filing (quarter ended June 30, 2026), its quarterly earnings presentation, the CEO’s annual letter to shareholders, and market data as of August 26, 2026.
FinScope — Independent, data-driven fundamental analysis


هنوز نظری برای این مقاله ثبت نشده است.