
Alphabet (GOOG) Stock Analysis 2026/تحلیل سهام آلفابت (گوگل) ۲۰۲۶
Fundamental and Technical Analysis of Alphabet (Google) Stock in 2026/تحلیل بنیادی و فنی سهام آلفابت (Google) در سال 2026
مقدمه/Introduction
Persian
در این مقاله، سهام Alphabet (GOOG) با رویکردی جامع، از منظر تحلیل بنیادی و تکنیکال بررسی میکنیم، از جمله رشد درآمد و EPS، سودآوری، وضعیت مالی، ارزشگذاری، قدرت نسبی سهم و روند قیمتی، تا تصویری دقیق از چشمانداز سهام گوگل در ۲۰۲۶ ارائه بشه.
English
This article provides a comprehensive fundamental and technical analysis of Alphabet (GOOG), covering revenue and EPS growth, profitability, financial strength, valuation, relative strength, and price action to assess the outlook for Google stock in 2026
Income Statement
Persian
واکاوی صورت سود و زیان الفابت (Alphabet Inc.) و پیشبینی سال ۲۰۲۶
چکیدهای بر ساختار گزارش سودآوری
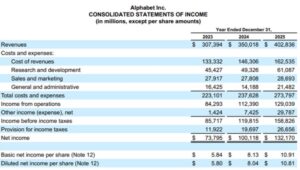
صورت سود و زیان (Income Statement) بهعنوان یکی از سه صورت مالی اساسی، عملکرد مالی یک شرکت رو در یک بازهی زمانی مشخص (معمولاً سالانه یا فصلی) گزارش میکنه. دادههای این گزارش که در تصویر پیوست ارائه شده، شامل دو بخش مجزاست:
۱. ارقام تاریخی سنوات ۲۰۲۳ تا ۲۰۲۵ (برگرفته از گزارشهای رسمی 10-K شرکت)
۲. پیشبینی سال مالی ۲۰۲۶ (بر اساس مدلسازی تحلیلگرانه)
در ادامه، هر یک از سطرهای این جدول رو با رویکردی تخصصی و بر مبنای اصول حسابداری و تحلیل مالی بررسی میکنیم.
بخش اول: تحلیل سطرهای صورت سود و زیان تاریخی
۱. Revenues
رشد درآمد از ۳۰۷.۴ میلیارد دلار در ۲۰۲۳ به ۴۰۲.۸ میلیارد دلار در ۲۰۲۵، معادل نرخ رشد مرکب سالانه (CAGR) ۱۴.۴٪، نشاندهندهی تسلط شرکت بر بازار تبلیغات دیجیتال و رشد چشمگیر بخش ابری (Google Cloud) هست.
۲. Cost of Revenues
نسبت این هزینه به درآمد از ۵۶.۶٪ در ۲۰۲۳ به ۵۹.۶٪ در ۲۰۲۵ بهبود پیدا کرده که حاکی از افزایش کارایی عملیاتی و کاهش هزینهی هر واحد درآمد هست.
۳. Operating Expenses
این بخش شامل سه زیرمجموعه است:
تحقیق و توسعه (R&D): رشد ۳۴.۴ درصدی در ۲۰۲۵ نشان از سرمایهگذاری تهاجمی در هوش مصنوعی و زیرساختهای نسل جدید داره.
فروش و بازاریابی (S&M): با رشد ناچیز، نشان از بلوغ و قدرت برند گوگل در جذب مشتری داره.
هزینههای عمومی و اداری (G&A): افزایش ۵۱ درصدی در ۲۰۲۵ عمدتاً ناشی از هزینههای حقوقی و جریمههای نهادهای نظارتی (مانند جریمهی ۱ میلیارد دلاری اتحادیه اروپا) بوده.
۴. Income from Operations
رشد این سطر از ۸۴.۳ میلیارد دلار به ۱۲۹ میلیارد دلار، بیانگر قدرت بنیادین شرکت در تولید سود پایدار هست.
۵. Other Income
این اقلام عمدتاً شامل سودهای تحققنیافته (Unrealized Gains) ناشی از افزایش ارزش سرمایهگذاریهای غیربازاری (مانند SpaceX و Anthropic) و درآمد بهره هست. جهش این رقم از ۱.۴ میلیارد دلار در ۲۰۲۳ به ۲۹.۸ میلیارد دلار در ۲۰۲۵، نشون دهنده عملکرد فوقالعادهی بخش سرمایه گذاری های جسورانه شرکت هستش.
۶. Tax Provision & Net Income
پس از کسر هزینههای مالیاتی (با نرخ مؤثر حدود ۱۶.۸ درصد)، سود خالص به ۱۳۲.۲ میلیارد دلار میرسه که معادل حاشیه سود خالص ۳۲.۸ درصدی هستش.
بخش دوم: پیشبینی سال ۲۰۲۶ – روش شناسی و مفروضات
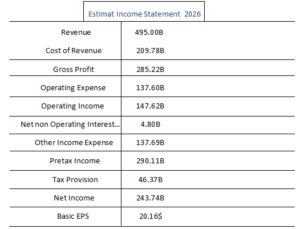
پیشبینی ارائهشده بر اساس مدل ترکیبی (Hybrid Model) و با استفاده از مفروضات زیر شکل گرفته:
- درآمد(۴۹۵ میلیارد دلار): بر اساس رشد ۲۳٪ (منطبق با رشد بخش ابری و تبلیغات).
- بهایتمامشده (۲۰۹.۸ میلیارد دلار): با فرض حاشیه سود ناخالص ۵۷.۶٪ (میانگین وزنی با تأکید بر روند صعودی).
- هزینههایعملیاتی (۱۳۷.۶ میلیارد دلار): بر اساس ۲۷.۸٪ از درآمد (میانگین سهساله با روند نزولی).
- سایردرآمدها (۱۳۷.۷ میلیارد دلار): مبتنی بر دادههای واقعی ۶ ماههی اول ۲۰۲۶ (۱۳۵.۷ میلیارد دلار) و فرض تداوم بخشی از اون در نیمهی دوم. این فرض، بیشترین تأثیر رو بر اختلاف پیشبینی ما با مدلهای محافظهکارانه (Non-GAAP) داره.
- مالیات(۴۶.۴ میلیارد دلار): با نرخ مؤثر ۱۶٪ (منطبق با میانگین تاریخی تعدیلشده برای اقلام غیرعملیاتی).
- EPSنهایی (۲۰.۱۶ دلار): با تقسیم سود خالص ۲۴۳.۷ میلیارد دلار بر میانگین موزون سهام (۱۲.۱ میلیارد سهم) محاسبه شده.
جمع بندی تحلیلی
جدول صورت سود و زیان الفابت، روایتی قوی از یک شرکت در اوج کارایی عملیاتی و مالی هستش. با این حال، سرمایهگذار حرفهای باید به دو نکتهی کلیدی توجه کنه:
۱. تفکیک سود عملیاتی از غیرعملیاتی (جهت محاسبهی قدرت سودآوری پایدار)
۲. تأثیر سرمایهگذاریهای عظیم هوش مصنوعی بر جریان نقدی آزاد و حاشیه های سود در کوتاه مدت
پی.نوشت: پیشبینی های 2026 نشون میده که شرکت با وجود فشار هزینه های سرمایه ای : همچنان در مسیر رشد سود آوری حرکت میکنه. اما تداوم این مسیر ، به موفقیت در تبدیل سرمایه گذاری های Ai به درآمدهای پایدار وابسته هستش.
نکته مهم
پیشبینیهای ارائه شده در محدوده میانی هستند و هیچ محدوده بالا یا پایینی ارائه نشده.
English
Analytical Paper: Dissecting Alphabet Inc.’s Income Statement and 2026 Forecast
Abstract on the Structure of the Profitability Report
The Income Statement, as one of the three core financial statements, reports a company’s financial performance over a specific period (typically annual or quarterly). The data presented in the attached image comprises two distinct sections:
- Historical figures for fiscal years 2023–2025 (extracted from official 10-K filings)
- Projections for fiscal year 2026 (based on analytical modeling)
Below, each line item of this statement is examined through a professional lens, grounded in accounting principles and financial analysis methodologies.
Part I: Line-by-Line Analysis of Historical Income Statement
- Revenues
The top-line figure represents total sales of goods and services over the fiscal year. Revenue growth from $307.4 billion in 2023 to $402.8 billion in 2025, representing a Compound Annual Growth Rate (CAGR) of 14.4%, underscores the company’s dominance in digital advertising and the exceptional expansion of Google Cloud.
- Cost of Revenues
This line captures direct costs associated with revenue generation (e.g., data center expenses, bandwidth, depreciation). The ratio of this cost to revenue (i.e., Gross Margin) improved from 56.6% in 2023 to 59.6% in 2025, reflecting enhanced operational efficiency and lower cost per revenue unit.
- Operating Expenses
This segment comprises three sub-categories:
- Research & Development (R&D): The 34.4% surge in 2025 indicates aggressive investment in artificial intelligence and next-generation infrastructure.
- Sales & Marketing (S&M): Modest growth reflects brand maturity and Google’s market pull.
- General & Administrative (G&A): The 51% spike in 2025 is primarily attributed to legal expenses and regulatory fines (e.g., the €1 billion EU antitrust penalty).
- Income from Operations
Core operating profit, before interest and taxes. The ascent from $84.3 billion to $129 billion demonstrates the company’s fundamental earnings power.
- Other Income (Expense), net
The most critical line from a qualitative analysis perspective. This primarily includes unrealized gains from fair value adjustments in non-marketable equity securities (e.g., SpaceX, Anthropic) and interest income. The leap from $1.4 billion in 2023 to $29.8 billion in 2025 highlights the stellar performance of Alphabet’s venture capital portfolio.
- Pre-Tax Income & Net Income
After applying an effective tax rate of ~16.8%, net income reaches $132.2 billion, translating to a Net Profit Margin of 32.8%.
Part II: 2026 Forecast – Methodology and Key Assumptions
The forecast is derived from a Hybrid Modeling Approach, incorporating the following assumptions:
- Revenue ($495B): Based on 23% YoY growth, aligned with Cloud and advertising momentum and analyst consensus.
- Cost of Revenue ($209.8B): Assumes Gross Margin of 57.6% (weighted average with upward trend emphasis).
- Operating Expenses ($137.6B): Calculated at 27.8% of revenue (three-year declining trend average).
- **Other Income (135.7B) and assuming partial continuation into H2. This assumption creates the largest variance from conservative Non-GAAP models.
- Tax Provision ($46.4B): Using an effective rate of 16% (historical average adjusted for non-operating items).
- **Final EPS (243.7B) by Weighted Average Shares (12.1 billion).
Analytical Conclusion
Alphabet’s income statement narrates a compelling story of operational excellence and financial strength. However, professional investors must focus on two key aspects:
- Segregation of operating vs. non-operating income to assess Sustainable Earnings Power.
- The impact of massive AI investments on free cash flow and margins in the short term.
While the 2026 forecast indicates continued profitability growth, the sustainability of this trajectory depends on the successful conversion of AI CapEx into recurring, high-margin revenue streams.
Disclaimer: This report serves purely analytical purposes and does not constitute a buy or sell recommendation. Investors are advised to conduct comprehensive due diligence before making investment .decisions
Important Point
The predictions provided are in the mid-range, with no upper or .lower limits provided
Annual EPS Trend
Persian
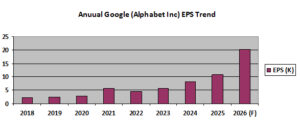
EPS سالانه شرکت آلفابت در انتهای سال 2018 برابر با $2.19 ، EPS سال 2019 با 12.32%رشد برابر با 2.46$ ، EPS سال 2020 با 19.10% رشد برابر با 2.93$ ، EPS سال 2021 با 91.46% رشد برابر با 5.61$ ، EPS سال 2022 با 23.02%- افول برابر با 4.56$ ، EPS سال 2023 با 27.19% رشد برابر با 5.80$ ، EPS سال 2024 با 38.62% رشد برابر با 8.04$ ، EPS سال 2025 با 34.45% رشد برابر با 10.81$ و طبق برآورد تحلیلی اینجانب Forward EPS سال 2026 با 86.49% رشد برابر با 20.16$ هست.
نکته حائز اهمیت این هستش که بجز سال 2022 ، EPS شرکت به طور پیاپی از سال 2018 رشد داشته و رشد تجمیعی کل 8 سال برابر با 920% بوده. البته از سال 2025 سایر درآمدهای عملیاتی رشد قابل توجهی داشته و این روند ذکر شده هم بر اساس اصل GAAP میباشد. اگر بر اساس اصل Normalized بخواهیم حساب کنیم ، رشد واقعی EPS در سال 2026 برابر با 10.25$ و در سال 2025 نیز برابر با 8.88$ میباشد که یعنی شاهد رشد 15.42% میباشد. این مقدار رشد در محدوده رشد مناسب بر اساس نوع صنعت-شرکت نمیباشد ، اما نسبت به حجم GDP قابل قبول هست. بنابراین سرمایه گذار رو نه منصرف ، بلکه مقداری وسواسی تر میکنه.
English
Alphabet Inc.’s annual EPS at the end of 2018 was $2.19. EPS in 2019 grew by 12.32% to $2.46. EPS in 2020 grew by 19.10% to $2.93. EPS in 2021 grew by 91.46% to $5.61. EPS in 2022 declined by -23.02% to $4.56. EPS in 2023 grew by 27.19% to $5.80. EPS in 2024 grew by 38.62% to $8.04. EPS in 2025 grew by 34.45% to $10.81, and according to my analytical estimate, Forward EPS for 2026 with 86.49% growth is $20.16.
It is important to note that, except for 2022, the company’s EPS has grown consistently year-over-year since 2018, and the cumulative growth for the entire 8 years is 920%. Of course, from 2025 onwards, other operating income has had significant growth, and this mentioned trend is based on GAAP principles. If calculated on a Normalized basis, the real EPS growth in 2026 would be $10.25, and in 2025 it would be $8.88, which means we are seeing a growth of 15.42%. This amount of growth is not within the appropriate range based on the industry-company type, but it is acceptable relative to the size of GDP. Therefore, it does not discourage the investor, but rather makes them somewhat more cautious.
Quaterly EPS Trend
Persian
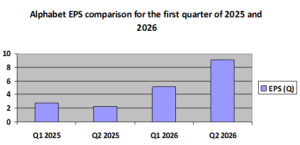
روند EPS در دو فصل اول مربوط به ابتدای 2026 ، روندی صعودی رو نسبت به مشابه سال گذشته ، یعنی دو فصل ابتدایی 2025 نشون میده. EPS سه ماهه مربوط به Q2 در 2026 برابر با 9.11$ هستش که نسبت به Q2 2025 با EPS 2.31$ تقریبا رشد 294% رو داشته. همچنین EPS سه ماهه مربوط به Q1 در 2026 نیز برابر با 5.81$ هستش که نسبت به Q1 2025 با EPS 2.81$ رشد 81% رو به ثبت رسونده.
مجدد به این نکته باید توجه کرد اصل روش محاسبه بر اساس GAAP هستش. اگر به صورت Normalized قصد برآورد داشته باشیم ، EPS سه ماهه Q2 2026 برابر با 5.38$ است که نسبت به مشابه سال گذشته رشد حدودی 132% داشته. همچنین EPS سه ماهه Q1 2026 برابر با 4.24$ هستش که نسبت به مشابه سال گذشته رشد تقریبی 51% داشته.
English
The EPS trend in the first two quarters at the beginning of 2026 shows an upward trend compared with the same period of the previous year, namely the first two quarters of 2025. The quarterly EPS for Q2 2026 was $9.11, which represents approximately 294% growth compared with Q2 2025, when EPS was $2.31. Also, the quarterly EPS for Q1 2026 was $5.81, representing 81% growth compared with Q1 2025, when EPS was $2.81.
It should again be noted that the primary calculation method is based on GAAP. If we intend to estimate on a Normalized basis, the quarterly EPS for Q2 2026 was $5.38, representing approximately 132% growth compared with the same period of the previous year. Also, the quarterly EPS for Q1 2026 was $4.24, representing approximately 51% growth compared with the same period of the previous year.
Revenue & Receivables
Persian
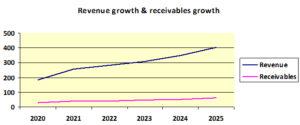
Revenue 2020…2025 به ترتیب: 182.5 ، 257.6 ، 282.8 ، 307.4 ، 350 ، 402.8
Receivables 2020…2025 به ترتیب: 30.9 ، 39.3 ، 40.3 ، 48 ، 52.3 ، 62.9
بررسی روند Revenue طی دوره 2020 تا 2025 نشون دهنده رشد مستمر درآمد شرکت هست، بهطوریکه Revenue از 182.5 در سال 2020 به 402.8 در سال 2025 رسیده و در مجموع حدود 120.7% افزایش پیدا کرده. با این حال، سرعت رشد درآمد در سالهای مختلف یکسان نبوده و پس از رشد قابلتوجه 41.2% در سال 2021، نرخ رشد در سالهای 2022 و 2023 به حدود 9.8% و 8.7% کاهش پیدا کرده و سپس در 2024 و 2025 مجدداً به حدود 13.9% و 15.1% افزایش پیدا کرده.
در مقابل، Receivables از 30.9 در سال 2020 به 62.9 در سال 2025 افزایش پیدا کرده که معادل رشد تجمعی حدود 103.6% هستش. نکته قابلتوجه اینه که رشد مطالبات در برخی سالها، بهویژه 2023 و 2025، از رشد Revenue بیشتر بوده. برای مثال در سال 2025، Revenue حدود 15.1% رشد کرده، در حالی که Receivables حدود 20.3% افزایش داشته.
با این حال، نسبت Receivables به Revenue طی این دوره عمدتاً در محدوده نسبتاً باثبات 14% تا 16% قرار داشته و از 16.9% در سال 2020 به 15.6% در سال 2025 رسیده. بنابراین، اگرچه افزایش مطلق مطالبات قابلتوجه بوده، رشد آن در مقیاس کل درآمد الزاماً بیانگر تشدید شدید ریسک وصول مطالبات نیست. با این وجود، افزایش سریعتر Receivables نسبت به Revenue در سال 2025 میتونه بهعنوان یک سیگنال قابل بررسی در خصوص کیفیت درآمد و چرخه وصول مطالبات تلقی بشه و بررسی شاخصهایی مانند Days Sales Outstanding (DSO) و جریان نقد عملیاتی میتونه ارزیابی دقیقتری از کیفیت این رشد ارائه بده.
نتیجه اینکه نسبت Receivables به Revenue در دوره مورد بررسی عمدتاً باثبات و حتی در انتهای دوره اندکی بهبود پیدا کرده. بنابراین کیفیت رشد درآمد از منظر مدیریت مطالبات، در مجموع قابلقبول ارزیابی میشه. بااینحال، رشد سریعتر مطالبات نسبت به Revenue در سال 2025 میتونه یک سیگنال هشدار اولیه باشه و برای تأیید یا رد اون، بررسی DSO و Operating Cash Flow ضروری هستش.
English
Revenue 2020…2025 / Respectively: 182.5 ، 257.6 ، 282.8 ، 307.4 ، 350 ، 402.8
Receivables 2020…2025 / Respectively: 30.9 ، 39.3 ، 40.3 ، 48 ، 52.3 ، 62.9
The analysis of the Revenue trend over the 2020–2025 period indicates continuous growth in the company’s revenue, with Revenue increasing from 182.5 in 2020 to 402.8 in 2025, representing an overall increase of approximately 120.7%. However, the pace of revenue growth was not consistent across the years. Following a significant growth rate of 41.2% in 2021, revenue growth declined to approximately 9.8% and 8.7% in 2022 and 2023, respectively, before increasing again to approximately 13.9% and 15.1% in 2024 and 2025.
In contrast, Receivables increased from 30.9 in 2020 to 62.9 in 2025, representing a cumulative increase of approximately 103.6%. Notably, the growth in receivables exceeded revenue growth in certain years, particularly in 2023 and 2025. For example, in 2025, Revenue grew by approximately 15.1%, while Receivables increased by approximately 20.3%.
Nevertheless, the Receivables-to-Revenue ratio remained relatively stable, generally within the range of 14% to 16% over the period, declining from 16.9% in 2020 to 15.6% in 2025. Therefore, although the absolute increase in receivables has been significant, their growth relative to overall revenue does not necessarily indicate a substantial deterioration in collection risk. However, the faster growth of Receivables relative to Revenue in 2025 can be considered a signal warranting further examination of revenue quality and the collection cycle. Analyzing indicators such as Days Sales Outstanding (DSO) and Operating Cash Flow can provide a more comprehensive assessment of the quality of this growth.
Overall, the Receivables-to-Revenue ratio remained largely stable throughout the period and even showed a slight improvement toward the end of the period. Therefore, the quality of revenue growth from the perspective of receivables management can generally be considered acceptable. Nevertheless, the faster growth of Receivables relative to Revenue in 2025 may represent an early warning signal, and further analysis of DSO and Operating Cash Flow is necessary to confirm or rule out such a concern
Cash Flows
Persian
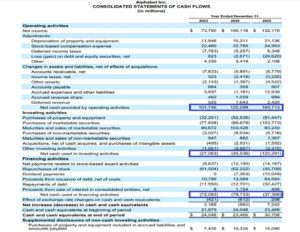
صورت جریان وجوه نقد در وضعیت مطلوبی قرار داره، چراکه شرکت ضمن تأمین مخارج سرمایهای و ایفای تعهدات بدهی، تونسته بخش عمده منابع موردنیاز خودش رو از محل جریانهای نقدی حاصل از فعالیتهای عملیاتی تأمین کنه. این ساختار نشاندهنده کیفیت مناسب جریان نقد، اتکای کمتر به منابع تأمین مالی خارجی و ظرفیت مطلوب شرکت برای تداوم عملیات و حمایت از رشد آتی هستش.
English
The company’s cash flow statement is in a favorable position, as it is simultaneously funding capital expenditures and servicing its debt obligations while generating sufficient operating cash flows to support its ongoing activities. This reflects strong cash-flow quality, lower reliance on external financing, and a solid capacity to sustain operations and fund future growth.
Persian
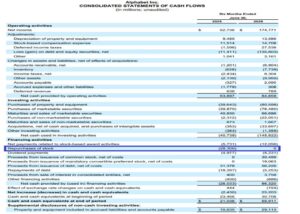
بازخرید سهام شرکت در نیمه نخست 2026 به صفر رسیده ، در حالی که این رقم در دوره مشابه سال قبل 28.30B و در دوره TTM 2025 برابر با 45.70B بوده. بنابراین، اثر کاهنده بازخرید سهام بر تعداد سهام منتشرشده عملاً متوقف شده و انتظار کاهش معنادار تعداد سهام در ادامه، محدود هست. در نتیجه، نباید رشد آتی EPS را صرفاً بر مبنای کاهش تعداد سهام ناشی از Buyback در نظر گرفت و تحقق رشد EPS بیش از پیش به بهبود عملکرد عملیاتی و رشد سود خالص وابسته هستش.
English
The company’s share repurchases fell to zero in the first half of 2026, compared with $28.30B during the same period of the previous year and $45.70B on a TTM 2025 basis. Consequently, the reduction in the outstanding share count attributable to buybacks has effectively ceased, limiting the likelihood of a meaningful further decline in shares outstanding. Therefore, future EPS growth should not be expected to come primarily from share-count reduction through buybacks, but rather from improvements in operating performance and net income growth.
Balance Sheets
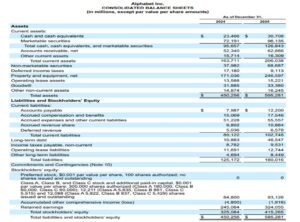
Persian
ترازنامه شرکت الفابت (۲۰۲۴–۲۰۲۵)
خلاصه اجرایی
این گزارش به تحلیل ساختاریافته و حرفهای تغییرات ترازنامه شرکت الفابت از پایان سال مالی ۲۰۲۴ تا ۲۰۲۵ میپردازه و بر محرکهای اصلی رشد داراییها، ساختار بدهیها و خلق ارزش برای سهامداران تمرکز داره.
بخش اول: گسترش داراییها – سرمایهگذاری زیرساختی در عصر هوش مصنوعی
کل داراییها: ۴۵۰.۳ → ۵۹۵.۳ میلیارد دلار (۳۲.۲+٪)
افزایش ۱۴۵ میلیارد دلاری عمدتاً ناشی از موارد زیر:
اموال،ماشینآلات و تجهیزات :(PP&E) 75.6+ میلیارد دلار (۴۴.۲ ٪)، از ۱۷۱.۰ به ۲۴۶.۶ میلیارد دلار. این نشون دهنده برنامه سرمایهگذاری تهاجمی شرکت، بهویژه در دیتاسنترها، سرورها و زیرساختهای شبکه برای پشتیبانی از هوش مصنوعی و سرویسهای ابری هست که بزرگترین محرک رشد داراییها محسوب میشه.
اوراق بهادار غیربازاری: ۳۰.۷+ میلیارد دلار (۸۰.۸+٪)، از ۳۸.۰ به ۶۸.۷ میلیارد دلار. این افزایش ناشی از تعدیلات ارزش منصفانه صعودی در پرتفوی سرمایهگذاری جسورانه الفابت (مانند SpaceX، Anthropic) هستش که نشون دهنده عملکرد قوی در بازارهای خصوصی هست. لازم به ذکر که این یک سود غیرنقدی و تحققنیافته هست و بر جریان نقدی عملیاتی تأثیری نداره.
وجوه نقد، معادلهای نقد و اوراق بهادار قابلفروش: ۳۱.۲+ میلیارد دلار (۳۲.۶+٪)، از ۹۵.۷ به ۱۲۶.۸ میلیارد دلار، که نشون دهنده تولید نقدینگی قوی از عملیات با وجود هزینههای سرمایهای سنگین هست.
بخش دوم: ساختار بدهیها
۱. کل بدهیها: ۱۲۵.۲ → ۱۸۰.۰ میلیارد دلار (۴۳.۸+٪)
افزایش ۵۴.۸ میلیارد دلاری ناشی از موارد زیر:
بدهی بلندمدت: ۳۵.۷+ میلیارد دلار (۳۲۷.۵+٪)، از ۱۰.۹ به ۴۶.۵ میلیارد دلار. این نشون دهنده انتشار اوراق قرضه جدید در سال ۲۰۲۵ (بهویژه ۲۲.۵ میلیارد دلار اوراق دلاری و ۱۳.۲۵ میلیارد یورو اوراق یورویی) برای تأمین مالی زیرساختهای هوش مصنوعی هست.
بدهیهای جاری: ۱۳.۶+ میلیارد دلار (۱۵.۳+٪)، از ۸۹.۱ به ۱۰۲.۷ میلیارد دلار، که ناشی از افزایش حسابهای پرداختنی (۴.۲+ میلیارد دلار) و هزینههای تعهدی هستش. این افزایش با گسترش مقیاس عملیاتی و فعالیتهای سرمایهگذاری همخوانی داره.
بخش سوم: حقوق صاحبان سهام – سود انباشته موتور خلق ارزش
کل حقوق صاحبان سهام: ۳۲۵.۱ → ۴۱۵.۳ میلیارد دلار (۲۷.۷+٪)
افزایش ۹۰.۲ میلیارد دلاری نشون دهنده موارد زیر:
سود انباشته: ۷۹.۰+ میلیارد دلار (۳۲.۲+٪)، از ۲۴۵.۱ به ۳۲۴.۱ میلیارد دلار، که ناشی از سود خالص ۱۳۲.۲ میلیارد دلاری و کسر سود سهام (~۱۵ میلیارد دلار) و بازخرید سهام (~۳۸ میلیارد دلار) هستش. این موضوع نشون دهنده توانایی بالا در انباشت سود و سرمایهگذاری مجدد محسوب میشه.
سرمایه پرداختشده مازاد: ۸.۳+ میلیارد دلار (۹.۸+٪)، از ۸۴.۸ به ۹۳.۱ میلیارد دلار که عمدتاً ناشی از مزایای مبتنی بر سهام هست.
بهبود سایر درآمدهای جامع: از ۴.۸- به ۱.۹- میلیارد دلار که نشون دهنده تعدیلات مطلوب ناشی از ترجمه ارزی و ارزشگذاری سرمایهگذاریها هست.
English
(Balance Sheet: Alphabet Inc. (2024–2025
Executive Summary
This report provides a structured, professional analysis of Alphabet Inc.’s balance sheet movements from fiscal year-end 2024 to 2025, focusing on key drivers of asset growth, liability structure, and shareholder value creation.
Part I: Asset Expansion – The AI-Driven Infrastructure Build-Out
(Total Assets: $450.3B → $595.3B (+32.2%
The $145B increase is primarily attributable to:
Property & Equipment (PP&E): +$75.6B (+44.2%), rising from $171.0B to $246.6B. This reflects Alphabet’s aggressive capital expenditure program, predominantly directed toward data centers, servers, and networking infrastructure to support AI and cloud services. This is the single largest driver of asset growth.
Non-Marketable Securities: +$30.7B (+80.8%), from $38.0B to $68.7B. This surge represents upward fair value adjustments in Alphabet’s venture capital portfolio (e.g., SpaceX, Anthropic), reflecting strong performance in private markets. Notably, this is a non-cash, unrealized gain and does not impact operating cash flow.
Cash, Equivalents & Marketable Securities: +$31.2B (+32.6%), from $95.7B to $126.8B, indicating strong liquidity generation from operations despite heavy CapEx.
Part II: Liability Structure – Prudent Leverage & Working Capital
Total Liabilities: $125.2B → $180.0B (+43.8%)
The $54.8B increase is driven by:
Long-Term Debt: +$35.7B (+327.5%), from $10.9B to $46.5B. This reflects new debt issuances in 2025 (notably $22.5B in USD and €13.25B in Euro notes) to fund AI infrastructure
Current Liabilities: +$13.6B (+15.3%), from $89.1B to 4.2B) and accrued expenses. This aligns with increased operational scale and investmePart III: Shareholders’ Equity – Retained Earnings Drive Value Creation
Part III: Shareholders’ Equity – Retained Earnings Drive Value Creation
Total Equity: $325.1B → $415.3B (+27.7%
The $90.2B increase reflects:
Retained Earnings: +$79.0B (+32.2%), from $245.1B to $324.1B, driven by 132.2B in net income partially offset by dividends (~15B) and share buybacks ($~38B). This demonstrates robust earnings retention and reinvestment capability.
Additional Paid-In Capital: +$8.3B (+9.8%), from $84.8B to $93.1B, primarily from stock-based compensation.
AOCI Improvement: From -1.9B, reflecting favorable foreign currency translation and investment valuation adjustments.nt activity.
Financial Ratios
Liquidity Ratio
Persian
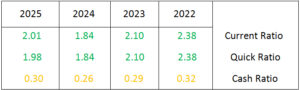
روند شاخص های نقدینگی نشون میده که اگرچه Current Ratio و Quick Ratio از 2022 تا 2024 کاهش پیدا کرده، در 2025 بخشی از افت خود را جبران کرده و به 2.01 و 1.98 رسیده. نزدیکی این دو نسبت بیانگر وابستگی محدود نقدینگی جاری به موجودی کالا و کیفیت مناسب داراییهای جاری هستش. Cash Ratio نیز با بازگشت از 0.26 به 0.30، ثبات نسبی ذخایر نقدی رو نشون میده. در مجموع ساختار نقدینگی شرکت مطلوب و بدون نشونه جدی از فشار کوتاهمدت ارزیابی میشه.
نکته: البته باید توجه داشت که فاصله بیش از حد از محدوده 1 در نسبت های نقدینگی برای این شرکت مناسب نیست. زیرا نشون میده که شرکت توانایی لازم برای مدیریت دارایی های نقدی رو نداره. بنابراین در کل بازه مورد برسی ، نسبت ها در محدوده مناسبی قرار داشتند.
English
The liquidity ratios show that although the Current Ratio and Quick Ratio declined from 2022 to 2024, both partially recovered in 2025 to 2.01 and 1.98, respectively. The narrow spread between the two ratios indicates limited reliance on inventory for short-term liquidity and a relatively strong quality of current assets. The Cash Ratio also recovered from 0.26 to 0.30, indicating relative stability in cash reserves. Overall, the company’s liquidity position appears sound, with no significant indication of short-term financial pressure.
Note: Of course, it should be noted that excessive distance from the range of 1 in liquidity ratios is not appropriate for this company. Because it shows that the company does not have the necessary ability to manage liquid assets. Therefore, throughout the entire period under review, the ratios have been within the appropriate range.
Efficiency Ratios
Persian
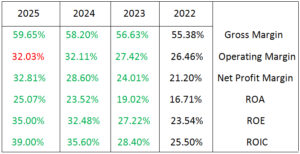
روند شاخصهای سودآوری طی 2022–2025 بیانگر بهبود مستمر کیفیت سود و بازده سرمایه هستش. Gross Margin از 55.38% به 59.65% افزایش پیدا کرده و Operating Margin هم از 26.46% به حدود 32% رسیده که حاکی از بهبود ساختار هزینه و اهرم عملیاتی مطلوب هست. در سطح نهایی، Net Profit Margin از 21.20% به 32.81% افزایش پیدا کرده که نشون از رشد قابلتوجه تبدیل درآمد به سود خالص هست.
همزمان ROA از 16.71% به 25.07% و ROE از 23.54% به 35% رسیدهاند، بنابراین کارایی تخصیص داراییها و سرمایه سهامداران بهطور معناداری ارتقا پیدا کرده. رشد ROIC از 25.50% به 39% هم مهمترین سیگنال این مجموعه هست و نشون میده بازده سرمایه بهکارگرفتهشده در سطحی بالا و رو به بهبود قرار داره. در مجموع، همجهتی این شاخصها تصویری از رشد سودآوری همراه با بهبود بازده عملیاتی، نه صرفاً افزایش سود اسمی ارائه میدن.
نکته: شاخص Operating Margin در سقف بازه مورد برسی دچار اندکی انحراف شده که یک مسئله طبیعی هست.
English
The profitability metrics for 2022–2025 indicate a consistent improvement in earnings quality and capital efficiency. Gross Margin increased from 55.38% to 59.65%, while Operating Margin rose from 26.46% to approximately 32%, indicating improved cost structure and favorable operating leverage. At the bottom line, Net Profit Margin expanded from 21.20% to 32.81%, reflecting a significant improvement in the company’s conversion of revenue into net income.
Meanwhile, ROA increased from 16.71% to 25.07% and ROE from 23.54% to 35%, indicating a meaningful improvement in the efficiency of asset and shareholder-capital utilization. The increase in ROIC from 25.50% to 39% is particularly significant, suggesting that returns on invested capital remain strong and continue to improve. Overall, the convergence of these metrics points to structural improvement in profitability and operating returns rather than merely nominal earnings growth.
Note: Note: The operating profit margin index in the final year deviated slightly from the upper limit of the range under consideration, which is a normal problem.
Activity Ratios
Persian
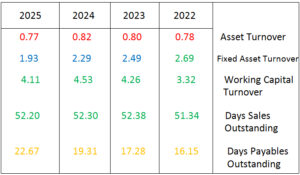
شاخصهای کارایی عملیاتی طی 2022–2025 تصویری نسبتاً دوگانه ارائه میدن. Asset Turnover تا 2024 بهبود داشته اما در 2025 به 0.77 کاهش پیدا کرده، در حالیکه Fixed Asset Turnover از 2.69 به 1.93 رسیده. این افت میتونه بیانگر کاهش بهرهوری داراییهای ثابت و وجود ظرفیت بلااستفاده یا رشد سریعتر مخرج نسبت به فروش باشه. در مقابل، Working Capital Turnover همچنان در سطح بالایی قرار داره و از 3.32 به 4.11 رسیده که نشون دهنده استفاده نسبتاً کارآمد از سرمایه در گردش هست.
DSO تقریباً ثابت و در محدوده 51–52 روز باقی مونده، بنابراین چرخه وصول مطالبات تغییر معناداری نداشته. در مقابل، DPO از 16.15 به 22.67 روز افزایش یافته که نشون دهنده استفاده بیشتر از مهلت پرداخت به تأمینکنندگان و در نتیجه بهبود نسبی مدیریت سرمایه در گردش و حفظ نقدینگی عملیاتی هست. در مجموع، نقطه قوت اصلی، ثبات چرخه وصول و بهبود DPO هستش، در حالیکه افت Fixed Asset Turnover مهمترین شاخصی است که نیاز به پایش داره. هرچند که باید دقت داشت که این شاخصه در محدوده مناسبی قرار داره ، ولی روند کاهشی باعث جذب توجهات میشه.
برتری نسبت DSO به DPO در یک حالت کلاسیک نکته منفی محسوب میشه چون خروج سرمایه نسبت به ورود سریعتر اتفاق میوفته. اما شرکت آلفابت یک شرکت خدماتی هست و عمده هزینه ها بابت حقوق کارگر ، قبض برق سرورها و … هست که پرداختش یک حالت انتخابی هست نه اجباری. پس این اختلاف ناشی از ضعف چانه زنی نیست.
عدم وجود نسبت Inventory Turnover در لیست ارائه شده این هست که عموما شرکت آلفابت یک شرکت خدماتی هست و موجودی فیزیکی قابل توجهی نداره.
English
Operating efficiency metrics for 2022–2025 present a relatively mixed picture. Asset Turnover improved through 2024 before declining to 0.77 in 2025, while Fixed Asset Turnover fell from 2.69 to 1.93, potentially indicating lower utilization of fixed assets, excess capacity, or asset growth outpacing revenue generation. In contrast, Working Capital Turnover remains relatively strong, increasing from 3.32 to 4.11, indicating efficient utilization of working capital.
DSO remained broadly stable at approximately 51–52 days, suggesting no material deterioration in the receivables collection cycle. Meanwhile, DPO increased from 16.15 to 22.67 days, indicating greater use of supplier payment terms and consequently some improvement in working-capital management and operating liquidity retention. Overall, stable collection efficiency and improving DPO are positive signals, while the decline in Fixed Asset Turnover represents the main efficiency metric requiring closer monitoring. Although it should be noted that this indicator is within a reasonable range, its downward trend is noteworthy.
The fact that DSO is higher than DPO is generally considered a negative factor under a classical framework, as cash outflows occur faster than cash inflows. However, Alphabet is a service-based company, and the majority of its expenses consist of employee compensation, server electricity bills, and similar costs, for which payment timing is largely discretionary rather than contractually constrained. Therefore, this gap does not necessarily reflect weak bargaining power with suppliers.
The absence of an inventory turnover ratio in the list provided is because Alphabet is generally a service company and does not have significant physical inventory.
Leverage Ratios
Persian
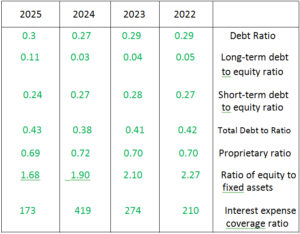
ساختار سرمایه طی 2022–2025 در مجموع کماهرم و از نظر solvency محافظهکارانه باقی مونده. Debt Ratio در محدوده 27–30% نوسان داشته و Proprietary Ratio نیز حوالی 70% قرار گرفته که نشون دهنده اتکای غالب به حقوق صاحبان سهام در تأمین داراییهاست. در همین حال، Short-term Debt to Equity از 0.28 به 0.24 کاهش پیدا کرده، هرچند Long-term Debt to Equity در 2025 به 0.11 افزایش پیدا کرده ، بنابراین تغییر ساختار بدهی بیشتر به سمت سررسیدهای بلندمدت حرکت کرده تا افزایش معنادار اهرم مالی….. و از این جهت شرکت یک تصمیم عاقلانه گرفته.
کاهش Ratio of Equity to Fixed Assets از 2.27 به 1.68 نیز حاکی از کاهش حاشیه پوشش داراییهای ثابت توسط حقوق صاحبان سهام هستش، اما همچنان سطح اون نشون دهنده پوشش مناسب هست. در نهایت Interest Expense Coverage با وجود افت از 419 به 173، همچنان در سطحی بسیار بالا قرار داره و بیانگر ریسک بسیار محدود خدمت بدهی و ظرفیت بالای پوشش هزینه مالی هست. در مجموع، ساختار بدهی شرکت همچنان بسیار سالم و کمریسک ارزیابی میشه و جهش بدهی بلندمدت در 2025 فعلاً فشار معناداری بر solvency ایجاد نکرده.
English
The capital structure remained low-leveraged and relatively conservative from a solvency perspective throughout 2022–2025. The Debt Ratio fluctuated within a narrow 27–30% range, while the Proprietary Ratio remained around 70%, indicating a predominant reliance on shareholders’ equity to finance assets. Meanwhile, Short-term Debt to Equity declined from 0.28 to 0.24, while Long-term Debt to Equity increased to 0.11 in 2025, suggesting a shift toward longer-term debt maturities rather than a material increase in overall financial leverage….. And in this regard, the company has made a wise decision.
The decline in the Equity-to-Fixed-Assets Ratio from 2.27 to 1.68 indicates a reduction in the equity buffer supporting fixed assets, although the level remains relatively strong. Finally, despite falling from 419 to 173, the Interest Expense Coverage Ratio remains exceptionally high, indicating very low debt-servicing risk and substantial capacity to absorb financing costs. Overall, the company’s debt structure remains highly sound and low-risk, with the increase in long-term debt in 2025 not yet creating meaningful pressure on solvency.
Market value Ratios
Persian
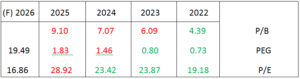
روند شاخص های ارزشگذاری طی 2022–2025 نشون دهنده افزایش قابلتوجه پریمیوم بازار نسبت به ارزش دفتری و سودآوری شرکت هست. P/B از 4.39 به 9.10 و P/E از 19.18 به 28.92 رسیدند، بنابراین بازار در حال حاضر بخش بیشتری از رشد و کیفیت سود آتی رو در قیمت سهم منعکس کرده. افزایش PEG از 0.73 به 1.83 هم نشون میده که نسبت قیمت به رشد، نسبت به گذشته فشردهتر شده و حاشیه اطمینان ارزشی (Margin of Safety) کاهش پیدا کرده.
با این حال، P/E فوروارد 2026 در سطح 16.86 قرار داره که فاصله معناداری با P/E تاریخی 2025 ایجاد میکنه. در صورت تحقق EPS مورد انتظار، این کاهش میتونه نشون دهنده رشد سود پیشبینیشده سریعتر از رشد قیمت سهم و در نتیجه تعدیل نسبی valuation باشه. بنابراین، با وجود گرانتر شدن سهم بر مبنای مضارب تاریخی، Forward P/E تصویر بنیادی مساعدتری ارائه میده و ارزیابی نهایی باید به تحقق EPS پیشبینیشده وابسته باشه.
در رابطه با P/B باید به این نکته توجه داشت که هرچند مدت نسبتا زیادی از افزایش سرمایه شرکت آلفابت گذشته ، اما با اینحال دلیل موجهی بر فاصله گرفتن نسبتا قابل توجه قیمت بر ارزش دفتری نیست.
همچنین به دلیل سودساز بودن شرکت ، الزامی در برسی P/S وجود نداره.
نکته: شاخص های ارزش بازار دائما درحال تغییر هستند و تمامی ضرایب آینده نگر بر حسب تاریخ کنونی هستند.
English
The valuation multiples over 2022–2025 indicate a significant expansion in the market premium relative to the company’s book value and earnings. P/B increased from 4.39 to 9.10, while P/E rose from 19.18 to 28.92, suggesting that the market is increasingly pricing in future growth and earnings quality. The rise in PEG from 0.73 to 1.83 further indicates a more demanding price-to-growth multiple and a lower valuation margin of safety compared with previous years.
However, the 2026 forward P/E stands at 16.86, creating a meaningful discount to the 2025 trailing P/E. If the projected EPS is achieved, this compression would imply that earnings growth is outpacing the increase in the share price, resulting in a relative normalization of valuation. Therefore, despite the stock appearing more expensive on historical multiples, the Forward P/E presents a more favorable fundamental valuation profile, with the key assumption being the realization of projected earnings.
Regarding the price-to-book value (P/B) ratio, it should be noted that although a relatively long time has passed since Alphabet’s capital increase, there is still no good reason for the relatively significant price-to-book value gap.
Also, due to the company’s profitability, there is no requirement to examine the P/S ratio.
Note: Market value ratios are constantly changing, and all forward-looking ratios are calculated based on current dates.
Conclusions from financial ratios
Persian
در مجموع، شاخص های مالی Alphabet Inc تصویری از بنیادهای مالی بسیار قدرتمند، رشد سودآوری باکیفیت و ساختار سرمایه کمریسک ارائه میدن. بهبود حاشیههای سود، ROA، ROE و ROIC در کنار نقدینگی مناسب و اهرم پایین، نشاندهنده کارایی بالای عملیاتی و توان قابلتوجه در خلق بازده از سرمایه بهکارگرفتهشده هستش. تنها نقاط قابل پایش، افت Fixed Asset Turnover و افزایش نسبی مطالبات و Long-term Debt در 2025 هستند. از منظر Valuation هم افزایش P/E و P/B نشون دهنده افزایش انتظارات بازار هست، هرچند Forward P/E برابر 16.86 در صورت تحقق رشد EPS، بخشی از این پریمیوم را توجیه میکنه. در مجموع، از منظر نسبت های مالی ، وضعیت شرکت مطلوب ارزیابی میشه.
English
Overall, Alphabet Inc.’s financial metrics present a picture of very strong financial fundamentals, high-quality earnings growth, and a low-risk capital structure. Improving profit margins, ROA, ROE, and ROIC, combined with adequate liquidity and low leverage, indicate strong operational efficiency and a significant ability to generate returns on invested capital.
The main areas that warrant monitoring are the decline in Fixed Asset Turnover and the relative increase in receivables and Long-term Debt in 2025. From a valuation perspective, the increase in P/E and P/B indicates higher market expectations, although a Forward P/E of 16.86, assuming the projected EPS growth materializes, provides some justification for this premium.
Overall, based on its financial ratios, the company’s financial position can be considered favorable.
Stock ,Supply & Demand
Persian
درحال حاضر Free Float سهام آلفابت مقداری بیشتر از 92% هستش. به عبارتی حدود 10.87B از برگه سهام شرکت برای معامله در بازار در دسترس هست و بخش اعظمی از سهام شرکت در دست سرمایه گذاران عمومی هست. هرچند که میزان نقدینگی در این سهام بسیار بالاست ، اما میزان انعطاف پذیری اون در برابر جو مثبت حاکم بر بازار هم کمتر هست.
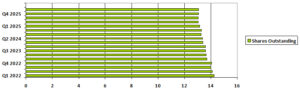
شرکت از نظر میزان سهام هم در نقطه ایده آل خودش قرار نداره، چرا که کل Shares outstanding در حدود 12.09B میباشد که به مانند توضیحات ارائه شده در بخش Free Float گرچه نقدشوندگی بالایی داره ، اما مدیریت اون در زمان های بحران برای سهامداران نهادی دشوار هستش ، اما نکته قابل تامل این هست که گرچه شرکت از نظر Free Float و Shares Outstanding ایده آل نیست اما روند Shares Outstanding و رفتار شرکت در غالب Buyback جای برسی داره. روند Shares Outstanding برای Alphabet کاملاً مطلوب هست. تعداد سهام منتشرشده از 14.24B در Q1 2022 به 13.05B در Q4 2025 کاهش پیدا کرده، یعنی حدود 8.4% contraction در share count. این کاهش تدریجی، در کنار Buybackهای مستمر، بهصورت مکانیکی از مخرج EPS کاسته و EPS accretion ایجاد کرده.
نکته مهم این است که روند کاهش سهام ساختاری و چندساله بوده و صرفاً ناشی از یک دوره کوتاه buyback نیست، بنابراین Supply overhang محدود و رفتار عرضه سهام مساعد ارزیابی میشه. بااینحال، توقف Buyback در نیمه اول 2026 باعث شده ظرفیت ادامه این tailwind کاهش پیدا کنه، بنابراین از این نقطه رشد EPS باید بیشتر از earnings growth تأمین بشه تا contraction در share count.
English
Currently, Alphabet’s Free Float stands at slightly above 92%. In other words, approximately 10.87B shares of the company are available for trading in the market, with the vast majority of the company’s shares being held by public investors. Although the liquidity of these shares is very high, their flexibility in responding to a prevailing positive market sentiment is comparatively lower.
The company is also not at its ideal level in terms of the number of shares, as total Shares Outstanding stands at approximately 12.09B. Similar to the points discussed in the Free Float section, while this provides a high level of liquidity, managing such a large share base during periods of market stress can be more challenging for institutional shareholders. However, an important point to consider is that although the company may not be at an ideal level in terms of Free Float and Shares Outstanding, the trend in Shares Outstanding and the company’s behavior regarding Buybacks deserve further examination. Alphabet’s share structure has been highly favorable. Shares outstanding declined from 14.24B in Q1 2022 to 13.05B in Q4 2025, representing approximately an 8.4% contraction in the share count. Combined with sustained buybacks, this reduction has mechanically lowered the denominator of EPS and generated meaningful EPS accretion.
Importantly, the decline in shares outstanding has been structural and multi-year, rather than the result of a short-term repurchase cycle. this indicates a limited supply overhang and favorable share-supply dynamics. However, the suspension of buybacks in H1 2026 reduces the likelihood of this tailwind continuing at the same pace; going forward, EPS expansion should therefore depend increasingly on underlying earnings growth rather than further share-count contraction.
Retained & Shareholders Equity
Persian
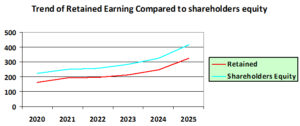
روند Retained Earnings و Shareholders’ Equity طی 2020–2025 در مجموع نشون دهنده تکوین تدریجی و سودمحور حقوق صاحبان سهام هست. Retained Earnings از 163.4 به 324.05 رسیده و حدود 98% رشد کرده، در حالیکه Shareholders’ Equity از 222.54 به 415.26 افزایش پیدا کرده و حدود 87% رشد داشته. بنابراین، رشد انباشته سود با سرعتی بالاتر از رشد کل حقوق صاحبان سهام اتفاق افتاده و وزن Retained Earnings در ساختار Equity هم از حدود 73% به 78% افزایش پیدا کرده.
این واگرایی بهطور کلی سیگنال مثبتی از کیفیت انباشت سرمایه داخلی محسوب میشه، یعنی بخش قابلتوجهی از تقویت Equity از محل سودهای انباشته و نه صرفاً تزریق سرمایه جدید شکل گرفته. جهش محسوس هر دو شاخص در 2025 هم نشون دهنده تقویت قابلتوجه ظرفیت سرمایهای داخلی شرکت هست.
رشد Retained نشون میده که شرکت سود واقعی و با کیفیتی تولید کرده و اونها رو مجدد در کسب و کار سرمایه گذاری کرده. در واقع این همون چیزی هست که یک سرمایه گذار نشون میده. چون Retained در نهایت با سرمایه گذاری درست به تدریج تبدیل به Shareholders Equity میشه.
English
The trend in Retained Earnings and Shareholders’ Equity over 2020–2025 indicates a progressive, earnings-driven accumulation of equity capital. Retained Earnings increased from 163.4 to 324.05, representing approximately 98% growth, while Shareholders’ Equity increased from 222.54 to 415.26, or approximately 87%. Consequently, retained earnings have grown faster than total equity, with their weight within the equity structure increasing from roughly 73% to 78%.
This divergence is generally a positive signal for internally generated capital formation, indicating that a substantial portion of the expansion in equity has been driven by accumulated earnings rather than merely by fresh capital contributions. The pronounced increase in both metrics in 2025 further points to a meaningful strengthening of the company’s internally generated capital base.
The growth in Retained Earnings indicates that the company has generated genuine, high-quality profits and reinvested them back into the business. In fact, this is exactly what an investor would want to see, because Retained Earnings, when properly reinvested, gradually translate into Shareholders’ Equity.
Major shareholders and institutional support
Major shareholders
Persian
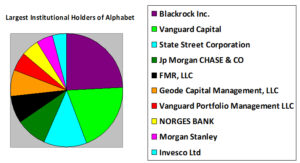
در تصویر بالا 10 تا از بزرگ ترین دارندگان سهام GOOG رو میتونیم ببینیم. توزیع سهام به صورت زیر هست:
Blackrock inc: 369.92
Vanguard capital management: 306.94
State street corporation: 190.92
J.P. Morgan chase: 137.83
FMR LLC: 121.96
Geode Capital Management LLC: 114.78
Vanguard Portfolio Management LLC: 78.67
Norges Bank: 74.79
Morgan Stanley: 72.43
Invesco Ltd: 66.09
نکته: مقادیر بر اساس میلیون واحد میباشد.
ساختار مالکیت نهادی GOOG از تمرکز قابلتوجه در میان مدیران دارایی بزرگ برخوردار هست، بهطوریکه BlackRock، Vanguard و State Street در مجموع حدود 867.8M سهم در اختیار دارند. حضور همزمان چندین نهاد بزرگ جهانی در میان سهامداران عمده، از منظر institutional sponsorship و عمق نقدشوندگی، ساختار مالکیت قدرتمندی ایجاد میکنه. با این حال، تمرکز بالای مالکیت در چند مدیر دارایی بزرگ میتونه به معنای همبستگی نسبی رفتار معاملاتی آنها در دورههای تغییر تخصیص سرمایه باشه. در مجموع، ترکیب فعلی نشاندهنده پشتیبانی نهادی قوی و shareholder base با کیفیت بالا برای GOOG هستش.
English
In the image above, we can see the 10 largest shareholders of GOOG. The distribution of shares is as follows:
Blackrock inc: 369.92
Vanguard capital management: 306.94
State street corporation: 190.92
J.P. Morgan chase: 137.83
FMR LLC: 121.96
Geode Capital Management LLC: 114.78
Vanguard Portfolio Management LLC: 78.67
Norges Bank: 74.79
Morgan Stanley: 72.43
Invesco Ltd: 66.09
Note: Valuesare based on millions of units.
GOOG’s institutional ownership structure exhibits meaningful concentration among major global asset managers, with BlackRock, Vanguard, and State Street collectively holding approximately 867.8M shares. The simultaneous presence of multiple large institutional investors provides strong institutional sponsorship and market depth, contributing to a high-quality shareholder base. However, the concentration among a small number of major asset managers may also imply some degree of correlation in trading behavior during portfolio rebalancing or shifts in capital allocation. Overall, the ownership structure indicates strong institutional support and a high-quality shareholder base for GOOG.
institutional support
Persian
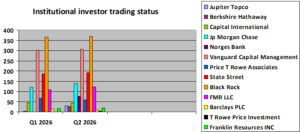
وضعیت معاملات نهادی از فصل سه ماهه Q1 2026 نسبت به سه ماهه دوم Q2 2026 به این صورت بوده:
(اعداد بر اساس میلیون برگه سهام هست، همچنین چپ مربوط به Q1 و سمت راست مربوط به Q2 هست)
Jupiter topco: 0 – 30.1
Berkshire Hathaway: 3.6 – 27.2
Capital International: 45.8 – 42
No Morgan: 120 – 138
Norges Bank: 0 – 74.8
Vanguard Capital Management: 302 – 307
Price to Rowe associates: 67.8 – 59.3
State street: 186 – 191
Black Rock: 365 – 370
FMR LLC: 109 – 122
Barclays PLC: 13.5 – 8.6
T Rowe price investment: 0.22 – 4.9
Franklin Resources inc: 17.3 – 21
روند مالکیت نهادی GOOG در Q2 2026 نسبت به Q1، در مجموع سیگنال مثبتی از Institutional Sponsorship ارائه میده. افزایش موقعیت BlackRock، Vanguard، State Street و FMR، در کنار ورود معنادار Norges Bank و Jupiter Topco، نشاندهنده تقویت تقاضای نهادی هست. همچنین رشد قابلتوجه Berkshire Hathaway و افزایش موقعیت Morgan، Capital International و Franklin Resources، در مجموع از net institutional accumulation حمایت میکنه.
در مقابل، کاهش موقعیت T. Rowe Price و Barclays نشون میده که این accumulation کاملاً یکدست نبوده است. با این حال، افزایش holdings در بخش عمدهای از نهادهای بزرگ و پایداری حمایت core institutional holders، ساختار مالکیت GOOG را در Q2 از منظر تقاضای نهادی مطلوبتر کرده است.
English
The institutional trading situation from Q1 2026 to Q2 2026 is as follows:
(Numbers are in millions of shares, also the left side is for Q1 and the right side is for Q2)
Jupiter topco: 0 – 30.1
Berkshire Hathaway: 3.6 – 27.2
Capital International: 45.8 – 42
No Morgan: 120 – 138
Norges Bank: 0 – 74.8
Vanguard Capital Management: 302 – 307
Price to Rowe associates: 67.8 – 59.3
State street: 186 – 191
Black Rock: 365 – 370
FMR LLC: 109 – 122
Barclays PLC: 13.5 – 8.6
T Rowe price investment: 0.22 – 4.9
Franklin Resources inc: 17.3 – 21
GOOG’s institutional ownership trend in Q2 2026 versus Q1 provides an overall positive signal for institutional sponsorship. Increased positions by BlackRock, Vanguard, State Street, and FMR, together with the meaningful initiation of positions by Norges Bank and Jupiter Topco, indicate strengthening institutional demand. The notable increases in Berkshire Hathaway, Morgan, Capital International, and Franklin Resources further support the presence of net institutional accumulation.
However, the reductions in holdings by T. Rowe Price and Barclays indicate that the accumulation was not entirely broad-based. Nevertheless, the increase across a significant portion of major institutional holders and the continued support from core institutional owners suggest that GOOG’s ownership structure became more favorable from an institutional-demand perspective in Q2.
Relative Strength & Market Leadership
Persian
بررسی این مولفه در تحلیل ما اهمیت داره، چراکه رشد بنیادی بهتنهایی کافی نیست، سهم باید از نظر قدرت نسبی قیمت و عملکرد در مقایسه با بازار و همگروهها هم در جایگاه مناسبی قرار داشته باشه. سهام با Relative Strength بالاتر معمولاً نشاندهنده تقاضای قویتر و رهبری قیمتی هستند و احتمال بیشتری داره که در یک روند صعودی پایدار، عملکردی فراتر از بازار ثبت کنند.
English
Examining this component is important in our analysis because fundamental growth alone is not sufficient. A stock should also maintain a strong position in terms of relative price strength and performance compared with the broader market and its peers. Stocks with higher Relative Strength generally indicate stronger demand and greater Price Leadership, making them more likely to outperform the market during a sustained uptrend.
Price Power
Persian
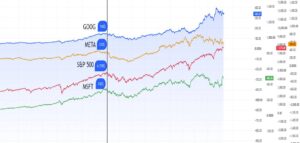
سهام گوگل از روز آغازین 2022 تا تاریخ کنونی یعنی 21 آگوست 2026 حدود 142% بازدهی داشته. این عدد برای سهام متا برابر با 64% بازدهی ، برای شاخص S&P 500 حدودا برابر با 60% بازدهی و برای سهام مایکروسافت برابر با 45% بازدهی هست. این Outperformance معنادار نشون دهنده قدرت نسبی و Price Leadership بالاتر آلفابت هست و مثبت تلقی میشه.
English
Google’s stock has generated a return of approximately 142% from the beginning of 2022 through the current date, August 21, 2026. By comparison, Meta’s stock has returned 64%, the S&P 500 has generated approximately 60%, and Microsoft’s stock has returned 45%.
This significant outperformance indicates Alphabet’s stronger relative strength and greater Price Leadership, which can be considered a positive factor.
Profit Making Power
Persian
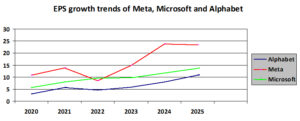
رشد EPS از 2020 تا 2025 نشون میده Alphabet با 268.94% رشد، فاصله معناداری با META 115.5% و Microsoft 137.5% ایجاد کرده. این EPS Compounding برتر نشون میده قدرت بالاتر در خلق سود و مؤید کیفیت مؤلفه Earnings و پشتوانه بنیادی مناسب برای Price Leadership سهم هستش.
English
From 2020 to 2025, Alphabet’s EPS increased by 268.94%, significantly outpacing META (115.50%) and Microsoft (137.50%). This superior EPS compounding reflects stronger earnings-generation capacity, reinforcing the quality of the E (Earnings) component and providing a solid fundamental foundation for the stock’s price leadership.
Profit Revenue
Persian
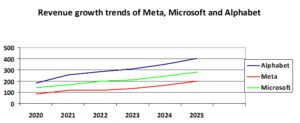
رشد Revenue طی 2020–2025 نشون میده که META با 133.76% بیشترین رشد topline رو داشته، اما Alphabet هم با 120.71% عملکردی نزدیک رو ثبت کرده. همچنین Microsoft با 96.97% در رتبه پایینتری قرار داره. بنابراین برتری Alphabet در EPS صرفاً ناشی از رشد Revenue نیست و بیشتر به Operating leverage، بهبود Margins و تبدیل کارآمدتر Revenue به سود مرتبط هست ، نکتهای که کیفیت رشد Earnings اون رو برجسته میکنه.
English
Revenue growth over 2020–2025 shows that META achieved the highest top-line growth at 133.76%, while Alphabet also recorded a strong and relatively close performance at 120.71%. Microsoft, meanwhile, ranked lower with 96.97% growth.
Therefore, Alphabet’s EPS outperformance is not merely a result of Revenue growth; it is more closely related to operating leverage, margin expansion, and a more efficient conversion of Revenue into earnings. This highlights the quality of its earnings growth.
New Growth Catalysts & Fundamental Drivers
Persian
گوگل سالها از تبلیغات Search پول درمیآورد، اما الان یک تغییر بزرگ در حال رخ دادن هست…..هوش مصنوعی.
مهمترین اتفاق جدید Gemini هستش. گوگل یک مدل هوش مصنوعی ساخته که قرار هست وارد همه محصولاتش بشه، مثل جیمیل، گوگل داکس، اندروید، سرچ و گوگل کلاد. اگر شرکتها و کاربران برای استفاده از این امکانات پول پرداخت کنند، میتونند یک منبع درآمد جدید برای گوگل ایجاد کنند.
دومین اتفاق مهم، تغییر موتور جستجوی گوگل با هوش مصنوعی (AI Search / AI Mode) هستش. قبلاً وقتی چیزی سرچ میکردی، گوگل فقط لینک سایتها رو نشون میداد، اما حالا میخواد خودش جواب هوشمند بده. این موضوع مهم هستش چون سرچ بزرگترین منبع درآمد تبلیغاتی گوگل هست. اگر گوگل بتونه کاربران رو حفظ کنه و تبلیغات رو بهتر هدفگیری کنه، سود شرکت افزایش پیدا کنه.
اتفاق سوم، رشد Google Cloud هست. شرکتها برای استفاده از هوش مصنوعی نیاز به سرور، دیتاسنتر و زیرساخت دارند. گوگل کلاد این خدمات رو ارائه میده و میتونه یکی از بخشهای سریعالرشد شرکت بشه.
اتفاق چهارم، Waymo (خودروهای خودران گوگل) هست. گوگل سالها روی ماشین بدون راننده کار کرده و اگر این فناوری در مقیاس بزرگ تجاری بشه، میتونه یک بازار جدید چند میلیارد دلاری ایجاد کنه.
اتفاق پنجم، AI Agent ها هستند. یعنی هوش مصنوعی فقط جواب سؤال نده، بلکه خودش کار رو انجام بده. مثلاً برات سفر رزرو کنه، ایمیل بزنه، خرید انجام بده یا کارهای روزمره رو مدیریت کنه. اگر گوگل در این حوزه موفق بشه، میتونه یک تغییر بزرگ در نحوه استفاده مردم از اینترنت ایجاد کنه.
نتیجه گیری
«گوگل از یک شرکت تبلیغاتی که از سرچ پول درمیاره، در حال تبدیل شدن به یک شرکت هوش مصنوعی و زیرساخت دیجیتال هستش.»
English
Google’s “N” in CANSLIM refers to the new growth drivers that can change the company’s future earnings.
For many years, Google mainly made money from Search advertising. Now the major change is Artificial Intelligence.
The biggest new factor is Gemini. Google has developed its own AI model and wants to integrate it into Gmail, Google Docs, Android, Search, and Google Cloud. If users and companies pay for these AI services, it could create a new revenue stream.
The second major factor is AI Search / AI Mode. In the past, Google Search mainly showed website links. Now Google is trying to provide direct AI-generated answers. This is important because Search advertising is Google’s biggest business. A successful AI transformation could protect and increase its advertising revenue.
The third factor is Google Cloud growth. Companies need computing power, data centers, and AI infrastructure. Google Cloud provides these services and could become a major growth engine.
The fourth factor is Waymo, Google’s autonomous driving business. If self-driving cars become widely commercialized, Waymo could create a completely new market for Alphabet.
The fifth factor is AI Agents. Instead of only answering questions, AI could perform tasks: booking trips, writing emails, managing schedules, and completing online activities.
Conclusion
Google’s N is the transformation from an advertising company into an AI and digital infrastructure company.
Business Model
Persian
شرکت دقیقاً چه کاری انجام میده؟
درآمد اصلی الفابت از تبلیغات دیجیتال (Google Search, YouTube Ads, Google Network) تأمین میشه که حدود ۷۵-۸۰٪ از درآمد رو تشکیل میده. اما نکته مهم اینه که الفابت صرفاً یه شرکت تبلیغاتی نیست. داره خودش رو به یه شرکت زیرساختی هوش مصنوعی و ابری تبدیل میکنه. بخش Google Cloud الان به موتور دوم رشد تبدیل شده. حالا سوال اینه که آیا درآمد اصلیاش واقعی هست؟ بله، تبلیغات پول نقد واقعی وارد شرکت میکنه و سودآوری فوقالعادهای داره.
English
?What exactly does the company do
Alphabet’s primary source of revenue is digital advertising (Google Search, YouTube Ads, and Google Network), which accounts for approximately 75–80% of total revenue.
However, the key point is that Alphabet is not merely an advertising company. It is increasingly transforming itself into an AI infrastructure and cloud company. Google Cloud has now become a second major growth engine.
Is its core revenue genuinely sustainable? Yes. Advertising generates real cash inflows for the company and has exceptionally strong profitability, with a gross margin of approximately 60%.
Comparative Advantage
Persian
آیا پیشتاز صنعت هست؟ تا چند سال آینده باقی میمونه؟
جستجو: با ~۹۰٪ سهم بازار، عملاً انحصار داره و هیچ رقیبی به گردش نمیرسه. این مزیت غیرقابل نفوذ هست.
یوتیوب: بزرگترین پلتفرم ویدئویی جهان با بیش از ۲.۵ میلیارد کاربر فعال ماهانه.
ابر گوگل: رتبه سوم بعد از AWS و Azure، ولی با رشد ۸۲٪ در سود عملیاتی (Q2 2026) در حال فاصله گرفتن از رقبا.
آیا تا ۴۰ سال دیگه هست؟ بله، مگر اینکه یک تحول فناورانه بنیادین (مثل ظهور Web3 یا تغییر کامل پارادایم جستجو) رخ بده. برند گوگل به قدری تثبیت شده که حتی خودش هم تبدیل به یک فعل در زبان انگلیسی شده (“Google it”).
English
Is the company an industry leader? Will it remain one over the next several years?
Search: With approximately 90% of the global search market, Google effectively holds a dominant position, with no competitor currently coming close to its scale. This represents a highly defensible competitive advantage.
YouTube: The world’s largest video platform, with more than 2.5 billion monthly active users.
Google Cloud: Ranked third behind AWS and Azure, but with operating income growing 82% in Q2 2026, it is rapidly strengthening its competitive position.
Will it still exist 40 years from now? Most likely, unless a fundamental technological disruption occurs—such as the emergence of Web3 or a complete paradigm shift in how search and information discovery work. The Google brand is so deeply established that its name has even become a verb in the English language: “Google it.
Management
Persian
رزومه مدیران و سابقه عملکردشون چیه؟
سوندار پیچای (مدیرعامل): سابقه درخشان در توسعه محصولات گوگل (کروم، اندروید). تحت مدیریت ایشون، ارزش بازار الفابت از ~۱ تریلیون به بیش از ۴ تریلیون دلار رسیده.
روث پورات (مدیر مالی): یکی از قدرتمندترین مدیران مالی سیلیکون ولی، سابقه در مورگان استنلی و گلدمن ساکس. تخصیص سرمایهای عالی (بازخرید سهام و سرمایهگذاری در AI).
نکته منفی: ساختار مدیریت متمرکز و تصمیمگیریهای کلان گاهی با تأخیر همراه بوده (مثل عقبماندگی در AI نسبت به OpenAI).
English
What is the background of the company’s executives, and what has their track record been?
Sundar Pichai (CEO): A strong track record in developing key Google products, including Chrome and Android. Under his leadership, Alphabet’s market capitalization has increased from approximately $1 trillion to more than $4 trillion.
Ruth Porat (CFO): One of the most influential financial executives in Silicon Valley, with prior experience at Morgan Stanley and Goldman Sachs. She has demonstrated strong capital allocation, particularly through share buybacks and investments in AI.
Negative factor: The company’s relatively centralized management structure can sometimes lead to delays in major strategic decisions, as seen in its initial lag behind OpenAI in the AI race.
Corporate Governance
Persian
آیا مدیران شفافیت دارن؟ آیا به سهامداران خرد پاسخ میدن؟
گزارشهای مالی الفابت بسیار شفاف و دقیق منتشر میشه. کنفرانسهای تلفنی فصلی با تحلیلگران برگزار میشه و به سوالات پاسخ داده میشه. اما ساختار سهام دوگانه (کلاس B با ۱۰ رأی) کنترل شرکت رو در دست بنیانگذاران و مدیران داخلی نگه داشته. این یعنی سهامداران خرد عملاً رأی مؤثری ندارن و مدیران تا حد زیادی از پاسخگویی مستقیم به اونها معاف هستن.
آیا مدیران پیچیده و غیرقابلفهم صحبت میکنن؟ خیر، معمولاً شفاف و مستقیم صحبت میکنن، ولی گاهی در مورد دعاوی حقوقی و ریسکهای نظارتی، اطلاعات رو محافظهکارانه ارائه میدن.
English
Are management practices transparent? Are executives responsive to minority shareholders?
Alphabet’s financial reporting is highly transparent and detailed. The company holds quarterly earnings calls with analysts, during which management addresses questions regarding financial performance, strategy, and key business developments. But Alphabet’s dual-class share structure—with Class B shares carrying 10 votes per share—keeps control of the company largely in the hands of its founders and insiders. This means minority shareholders have limited effective voting power, while management is to a significant extent insulated from direct shareholder pressure.
Do executives communicate in a complex or difficult-to-understand manner? Generally, no. Management tends to communicate clearly and directly. However, when discussing legal disputes and regulatory risks, disclosures can sometimes be relatively cautious and conservative.
Industry
Persian
قیمتگذاری دستوری؟ رقابت؟ انحصار؟
قیمتگذاری کاملاً آزاد و بر اساس مکانیسم بازار (حراج تبلیغات). هیچ قیمتگذاری دستوری وجود نداره. رقابت در جستجو انحصار، در تبلیغات رقابت شدید با متا، در ابر رقابت سهقطبی با آمازون و مایکروسافت.
همچنین بزرگترین تهدید صنعت، دعاوی ضد انحصار در آمریکا و اروپاست که میتونه مدل کسبوکار رو تحت تأثیر قرار بده.
English
?Price Controls? Competition? Monopoly
Pricing is entirely market-driven and determined through the advertising auction mechanism. There is no government-imposed price control. In Search, Google holds a dominant position that is effectively monopolistic; in digital advertising, it faces intense competition from Meta; and in Cloud, it competes in a three-way market alongside Amazon and Microsoft.
The biggest industry-level threat is antitrust litigation and regulatory action in the United States and Europe, which could potentially have a significant impact on Alphabet’s business model.
Valuation
Persian
بر اساس تحلیل های بنیادی ارائه شده ، ارزش سهام GOOG رو در ادامه مسیر میشه به 3 سطح اصلی دسته بندی کرد:
محافظه کارانه: 383$
واقع بینانه: 405$
خوش بینانه: 443$
نکته: قیمتهای ذکر شده باید به واسطه تحلیل تکنیکال به محدودههای قیمتی تبدیل بشن.
English
Based on the fundamental analyses presented, the potential valuation of GOOG going forward can be categorized into three main levels:
Conservative: $383
Base Case: $405
Optimistic: $443
These levels represent three different valuation scenarios based on the underlying fundamental assumptions.
Note: The aforementioned price targets should be translated into specific price ranges through technical analysis.
Technical
برسی وضعیت بنیادین سهام رکن بسیار مهمی از جهت سلامت شرکت هست ، اما تجزیه و تحلیل فنی در کنار تحلیل بنیادین ، تصویر کامل تری از شرایط سهام به ما نشون میده. همچنین اگرچه ما به واسطه تحلیل بنیادی تونستیم شرکت رو ارزیابی و ارزش گذاری کنیم ، اما برای ورود بهینه به سرمایه گذاری ، همچنین دقیق تر مارک کردن هدف قیمتی و پیاده کردن استراتژی های مدیریت سرمایه باید از تحلیل فنی استفاده کنیم.
Ichimoku , Andrew Pitchfork , Price Action
Persian
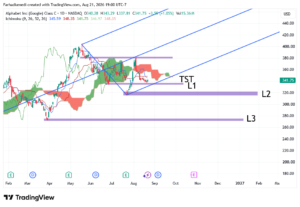
بر اساس Price Action با متد لنس بگز ، نمودار قیمتی در محدوده های Low در ستاپ TST هستش. همچنین با برسی موج قبلی اصلاحی از سقف تا کف متوجه میشیم که فرازها کوتاه تر و عمق هر اصلاح عمیق تر شده. از طرفی محدوده مناسب این ستاپ تلاقی مهمی با Right Line سبک Pitchfork و Flat Span B در Ichimoku پیدا کرده.
خرید
اصولا ایمن ترین حالت خرید ، به صورت خرید 3 پله ای در محدوده های مناسب هست تا اگر نمودار اصلاح هایی رو انجام داد ، میانگین کل خرید در ارقام بالا حفظ بشه. به عبارتی سرمایه اختصاص یافته طبق تصویر ،در 3 لول های مشخص شده شامل:
سطح1: محدوده های فعلی شامل 336$ الی 340$
سطح2: محدوده قیمتی 316$ الی 319$
سطح 3: محدوده قیمتی 271$ الی 273$
هدف
هدف های قیمتی تحلیل فنی ، دارای همبستگی با تحلیل بنیادی هستند. به طوری که محدوده های قیمتی 381$ ، 400$ و 440$ میتونند هدف باشند.
حدضرر
این بخش کاملا بستگی به استراتژی شخصی داره و میتونه شامل درصد معقولی از سرمایه اختصاص یافته ، تغییر در نگرش بنیادی و …. باشه.
English
Based on Price Action using Lance Beggs’ methodology, the price chart is currently in a Low area within a TST setup. Furthermore, by examining the previous corrective wave from the high to the low, we can observe that the swings have become shorter while the depth of each correction has increased. At the same time, the appropriate zone for this setup has a significant confluence with the Right Line of the Pitchfork methodology and Flat Span B in Ichimoku.
Buy
In general, the safest approach to entering a position is to scale into the trade across three levels. This allows the overall entry price to remain at a favorable level if the chart undergoes further corrections. In other words, the allocated capital, as shown in the chart, is divided across the following three levels:
• Level 1: Current price zone: $336–$340
• Level 2: Price zone: $316–$319
• Level 3: Price zone: $271–$273
Targets
The technical analysis price targets show a strong correlation with the fundamental valuation analysis. Accordingly, the following price zones can be considered potential targets:
$381, $400, and $440
Stop-Loss
This section depends entirely on the individual investment strategy and risk tolerance. It may be based on allocating a reasonable percentage of capital to the position, a change in the fundamental outlook, or other predefined risk-management criteria.


هنوز نظری برای این مقاله ثبت نشده است.